[ ]:
%matplotlib inline
Determining and plotting the altitude/azimuth of a celestial object
This example demonstrates coordinate transformations and the creation of visibility curves to assist with observing run planning.
In this example, we make a ~astropy.coordinates.SkyCoord instance for M33. The altitude-azimuth coordinates are then found using astropy.coordinates.EarthLocation and astropy.time.Time objects.
This example is meant to demonstrate the capabilities of the astropy.coordinates package. For more convenient and/or complex observation planning, consider the astroplan <https://astroplan.readthedocs.org/>_ package.
By: Erik Tollerud, Kelle Cruz License: BSD
Let’s suppose you are planning to visit picturesque Bear Mountain State Park in New York, USA. You’re bringing your telescope with you (of course), and someone told you M33 is a great target to observe there. You happen to know you’re free at 11:00 pm local time, and you want to know if it will be up. Astropy can answer that.
Make print work the same in all versions of Python, set up numpy, matplotlib, and use a nicer set of plot parameters:
[1]:
import numpy as np
import matplotlib.pyplot as plt
from astropy.visualization import astropy_mpl_style
plt.style.use(astropy_mpl_style)
c:\users\kurt\appdata\local\programs\python\python37\lib\site-packages\numpy\_distributor_init.py:32: UserWarning: loaded more than 1 DLL from .libs:
c:\users\kurt\appdata\local\programs\python\python37\lib\site-packages\numpy\.libs\libopenblas.PYQHXLVVQ7VESDPUVUADXEVJOBGHJPAY.gfortran-win_amd64.dll
c:\users\kurt\appdata\local\programs\python\python37\lib\site-packages\numpy\.libs\libopenblas.TXA6YQSD3GCQQC22GEQ54J2UDCXDXHWN.gfortran-win_amd64.dll
  stacklevel=1)
Import the packages necessary for finding coordinates and making coordinate transformations
[2]:
import astropy.units as u
from astropy.time import Time
from astropy.coordinates import SkyCoord, EarthLocation, AltAz
astropy.coordinates.SkyCoord.from_name uses Simbad to resolve object names and retrieve coordinates.
Get the coordinates of M33:
[3]:
m33 = SkyCoord.from_name('M33')
Use astropy.coordinates.EarthLocation to provide the location of Bear Mountain and set the time to 11pm EDT on 2012 July 12:
[4]:
bear_mountain = EarthLocation(lat=41.3*u.deg, lon=-74*u.deg, height=390*u.m)
utcoffset = -4*u.hour  # Eastern Daylight Time
time = Time('2012-7-12 23:00:00') - utcoffset
astropy.coordinates.EarthLocation.get_site_names and ~astropy.coordinates.EarthLocation.get_site_names can be used to get locations of major observatories.
Use astropy.coordinates to find the Alt, Az coordinates of M33 at as observed from Bear Mountain at 11pm on 2012 July 12.
[5]:
m33altaz = m33.transform_to(AltAz(obstime=time,location=bear_mountain))
print("M33's Altitude = {0.alt:.2}".format(m33altaz))
M33's Altitude = 0.13 deg
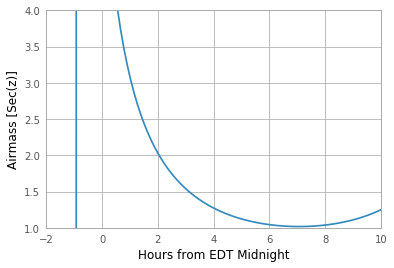
This is helpful since it turns out M33 is barely above the horizon at this time. It’s more informative to find M33’s airmass over the course of the night.
Find the alt,az coordinates of M33 at 100 times evenly spaced between 10pm and 7am EDT:
[6]:
midnight = Time('2012-7-13 00:00:00') - utcoffset
delta_midnight = np.linspace(-2, 10, 100)*u.hour
frame_July13night = AltAz(obstime=midnight+delta_midnight,
                          location=bear_mountain)
m33altazs_July13night = m33.transform_to(frame_July13night)
convert alt, az to airmass with ~astropy.coordinates.AltAz.secz attribute:
[7]:
m33airmasss_July13night = m33altazs_July13night.secz
Plot the airmass as a function of time:
[8]:
plt.plot(delta_midnight, m33airmasss_July13night)
plt.xlim(-2, 10)
plt.ylim(1, 4)
plt.xlabel('Hours from EDT Midnight')
plt.ylabel('Airmass [Sec(z)]')
plt.show()
Use ~astropy.coordinates.get_sun to find the location of the Sun at 1000 evenly spaced times between noon on July 12 and noon on July 13:
[9]:
from astropy.coordinates import get_sun
delta_midnight = np.linspace(-12, 12, 1000)*u.hour
times_July12_to_13 = midnight + delta_midnight
frame_July12_to_13 = AltAz(obstime=times_July12_to_13, location=bear_mountain)
sunaltazs_July12_to_13 = get_sun(times_July12_to_13).transform_to(frame_July12_to_13)
Do the same with ~astropy.coordinates.get_moon to find when the moon is up. Be aware that this will need to download a 10MB file from the internet to get a precise location of the moon.
[10]:
from astropy.coordinates import get_moon
moon_July12_to_13 = get_moon(times_July12_to_13)
moonaltazs_July12_to_13 = moon_July12_to_13.transform_to(frame_July12_to_13)
Find the alt,az coordinates of M33 at those same times:
[11]:
m33altazs_July12_to_13 = m33.transform_to(frame_July12_to_13)
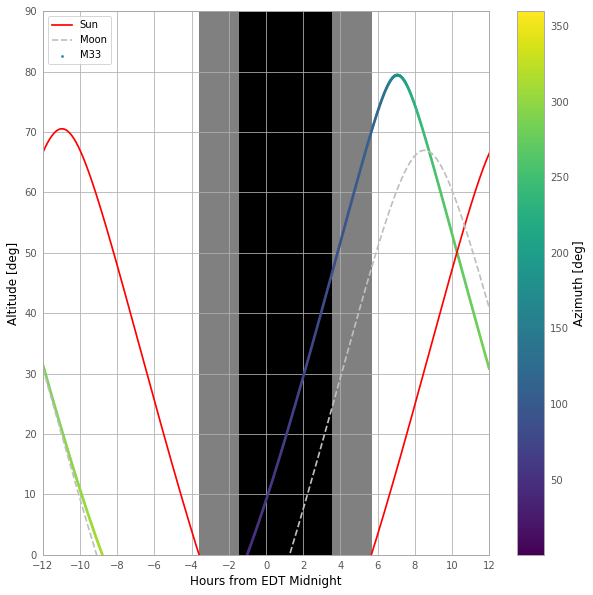
Make a beautiful figure illustrating nighttime and the altitudes of M33 and the Sun over that time:
[15]:
plt.figure(figsize=(10,10))
plt.plot(delta_midnight, sunaltazs_July12_to_13.alt, color='r', label='Sun')

plt.plot(delta_midnight, moonaltazs_July12_to_13.alt, color=[0.75]*3, ls='--', label='Moon')
plt.scatter(delta_midnight, m33altazs_July12_to_13.alt,
            c=m33altazs_July12_to_13.az, label='M33', lw=0, s=8,
            cmap='viridis')
plt.fill_between(delta_midnight.to('hr').value, 0, 90,
                 sunaltazs_July12_to_13.alt < -0*u.deg, color='0.5', zorder=0)
plt.fill_between(delta_midnight.to('hr').value, 0, 90,
                 sunaltazs_July12_to_13.alt < -18*u.deg, color='k', zorder=0)
plt.colorbar().set_label('Azimuth [deg]')
plt.legend(loc='upper left')
plt.xlim(-12, 12)
plt.xticks(np.arange(13)*2 -12)
plt.ylim(0, 90)
plt.xlabel('Hours from EDT Midnight')
plt.ylabel('Altitude [deg]')
plt.show()
[ ]: