
https://www.kaggle.com/anikannal/solar-power-generation-data
There are a few areas of concern at the solar power plant:
| DATE_TIME | PLANT_ID | SOURCE_KEY | AMBIENT_TEMPERATURE | MODULE_TEMPERATURE | IRRADIATION | |
|---|---|---|---|---|---|---|
| 3176 | 2020-06-17 22:30:00 | 4135001 | HmiyD2TTLFNqkNe | 22.171737 | 21.080829 | 0.0 |
| 3177 | 2020-06-17 22:45:00 | 4135001 | HmiyD2TTLFNqkNe | 22.150570 | 21.480377 | 0.0 |
| 3178 | 2020-06-17 23:00:00 | 4135001 | HmiyD2TTLFNqkNe | 22.129816 | 21.389024 | 0.0 |
| 3179 | 2020-06-17 23:15:00 | 4135001 | HmiyD2TTLFNqkNe | 22.008275 | 20.709211 | 0.0 |
| 3180 | 2020-06-17 23:30:00 | 4135001 | HmiyD2TTLFNqkNe | 21.969495 | 20.734963 | 0.0 |
| 3181 | 2020-06-17 23:45:00 | 4135001 | HmiyD2TTLFNqkNe | 21.909288 | 20.427972 | 0.0 |
| DATE_TIME | PLANT_ID | SOURCE_KEY | DC_POWER | AC_POWER | DAILY_YIELD | TOTAL_YIELD | TOTAL_YIELDkWh | |
|---|---|---|---|---|---|---|---|---|
| 0 | 2020-05-15 | 4136001 | 4UPUqMRk7TRMgml | 0.0 | 0.0 | 9425.000000 | 2.429011e+06 | 8.744440e+03 |
| 1 | 2020-05-15 | 4136001 | 81aHJ1q11NBPMrL | 0.0 | 0.0 | 0.000000 | 1.215279e+09 | 4.375003e+06 |
| 2 | 2020-05-15 | 4136001 | 9kRcWv60rDACzjR | 0.0 | 0.0 | 3075.333333 | 2.247720e+09 | 8.091790e+06 |
| 3 | 2020-05-15 | 4136001 | Et9kgGMDl729KT4 | 0.0 | 0.0 | 269.933333 | 1.704250e+06 | 6.135300e+03 |
| 4 | 2020-05-15 | 4136001 | IQ2d7wF4YD8zU1Q | 0.0 | 0.0 | 3177.000000 | 1.994153e+07 | 7.178949e+04 |
| 5 | 2020-05-15 | 4136001 | LYwnQax7tkwH5Cb | 0.0 | 0.0 | 1872.500000 | 1.794959e+09 | 6.461851e+06 |
I guessed that the values of total yield for plant 2 were not comparable with those of plant 1 in the original form. So I took a guess and used a unit conversion formula: 1kWh = 3.6⋅106J = 3600kJ = 3.6MJ = 0.0036GJ
Mean yield in kWh plant 2: 2372201 Mean yield in kWh plant 1: 6978712
solar1GEN['DATE'] = pd.to_datetime(solar1GEN['DATE_TIME'],format ='%Y-%m-%d')
We drop the PLANT_ID's to spare memory, and rename the inverter labels.
First rename these strange labels
| New_Code | |
|---|---|
| Old_Code | |
| wCURE6d3bPkepu2 | A21 |
| z9Y9gH1T5YWrNuG | A22 |
| zBIq5rxdHJRwDNY | A23 |
| zVJPv84UY57bAof | A24 |
| YxYtjZvoooNbGkE | A25 |
| DATE_TIME | SOURCE_KEY | DC_POWER | AC_POWER | DAILY_YIELD | TOTAL_YIELD | DATE | TIME | |
|---|---|---|---|---|---|---|---|---|
| 0 | 2020-05-15 00:00:00 | A1 | 0.0 | 0.0 | 0.0 | 6259559.0 | 2020-05-15 | 00:00:00 |
| 21 | 2020-05-15 00:15:00 | A1 | 0.0 | 0.0 | 0.0 | 6259559.0 | 2020-05-15 | 00:15:00 |
| 42 | 2020-05-15 00:30:00 | A1 | 0.0 | 0.0 | 0.0 | 6259559.0 | 2020-05-15 | 00:30:00 |
| 63 | 2020-05-15 00:45:00 | A1 | 0.0 | 0.0 | 0.0 | 6259559.0 | 2020-05-15 | 00:45:00 |
| 84 | 2020-05-15 01:00:00 | A1 | 0.0 | 0.0 | 0.0 | 6259559.0 | 2020-05-15 | 01:00:00 |
| ... | ... | ... | ... | ... | ... | ... | ... | ... |
| 68689 | 2020-06-17 22:45:00 | A24 | 0.0 | 0.0 | 5910.0 | 7363272.0 | 2020-06-17 | 22:45:00 |
| 68711 | 2020-06-17 23:00:00 | A24 | 0.0 | 0.0 | 5910.0 | 7363272.0 | 2020-06-17 | 23:00:00 |
| 68733 | 2020-06-17 23:15:00 | A24 | 0.0 | 0.0 | 5910.0 | 7363272.0 | 2020-06-17 | 23:15:00 |
| 68755 | 2020-06-17 23:30:00 | A24 | 0.0 | 0.0 | 5910.0 | 7363272.0 | 2020-06-17 | 23:30:00 |
| 68777 | 2020-06-17 23:45:00 | A24 | 0.0 | 0.0 | 5910.0 | 7363272.0 | 2020-06-17 | 23:45:00 |
68778 rows × 8 columns
| DATE_TIME | SOURCE_KEY | DC_POWER | AC_POWER | DAILY_YIELD | TOTAL_YIELD | TOTAL_YIELDkWh | DATE | TIME | |
|---|---|---|---|---|---|---|---|---|---|
| 0 | 2020-05-15 00:00:00 | B1 | 0.0 | 0.0 | 9425.000000 | 2.429011e+06 | 8.744440e+03 | 2020-05-15 | 00:00:00 |
| 1 | 2020-05-15 00:00:00 | B2 | 0.0 | 0.0 | 0.000000 | 1.215279e+09 | 4.375003e+06 | 2020-05-15 | 00:00:00 |
| 2 | 2020-05-15 00:00:00 | B3 | 0.0 | 0.0 | 3075.333333 | 2.247720e+09 | 8.091790e+06 | 2020-05-15 | 00:00:00 |
| 3 | 2020-05-15 00:00:00 | B4 | 0.0 | 0.0 | 269.933333 | 1.704250e+06 | 6.135300e+03 | 2020-05-15 | 00:00:00 |
| 4 | 2020-05-15 00:00:00 | B5 | 0.0 | 0.0 | 3177.000000 | 1.994153e+07 | 7.178949e+04 | 2020-05-15 | 00:00:00 |
| ... | ... | ... | ... | ... | ... | ... | ... | ... | ... |
| 67693 | 2020-06-17 23:45:00 | B18 | 0.0 | 0.0 | 4157.000000 | 5.207580e+05 | 1.874729e+03 | 2020-06-17 | 23:45:00 |
| 67694 | 2020-06-17 23:45:00 | B19 | 0.0 | 0.0 | 3931.000000 | 1.211314e+08 | 4.360729e+05 | 2020-06-17 | 23:45:00 |
| 67695 | 2020-06-17 23:45:00 | B20 | 0.0 | 0.0 | 4322.000000 | 2.427691e+06 | 8.739688e+03 | 2020-06-17 | 23:45:00 |
| 67696 | 2020-06-17 23:45:00 | B21 | 0.0 | 0.0 | 4218.000000 | 1.068964e+08 | 3.848270e+05 | 2020-06-17 | 23:45:00 |
| 67697 | 2020-06-17 23:45:00 | B22 | 0.0 | 0.0 | 4316.000000 | 2.093357e+08 | 7.536087e+05 | 2020-06-17 | 23:45:00 |
67698 rows × 9 columns
| DATE_TIME | SOURCE_KEY | DC_POWER | AC_POWER | DAILY_YIELD | TOTAL_YIELD | DATE | TIME | |
|---|---|---|---|---|---|---|---|---|
| 10855 | 2020-05-20 08:30:00 | A6 | 701.7875 | 687.275 | 724.25 | 7240266.25 | 2020-05-20 | 08:30:00 |
| 64692 | 2020-06-16 01:00:00 | A10 | 0.0000 | 0.000 | 0.00 | 7261315.00 | 2020-06-16 | 01:00:00 |
| DATE_TIME | SOURCE_KEY | DC_POWER | AC_POWER | DAILY_YIELD | TOTAL_YIELD | TOTAL_YIELDkWh | DATE | TIME | |
|---|---|---|---|---|---|---|---|---|---|
| 1345 | 2020-05-15 15:15:00 | B4 | 817.486667 | 800.093333 | 3110.133333 | 1.707360e+06 | 6146.49648 | 2020-05-15 | 15:15:00 |
| 18401 | 2020-05-24 17:30:00 | B2 | 0.000000 | 0.000000 | 0.000000 | 0.000000e+00 | 0.00000 | 2020-05-24 | 17:30:00 |
Limit temperature and irradiation values' level of precision
| SOURCE_KEY | DC_POWER | AC_POWER | DAILY_YIELD | TOTAL_YIELD | DATE | TIME | |
|---|---|---|---|---|---|---|---|
| DATE_TIME | |||||||
| 2020-05-15 | A6 | 1231.91 | 1201.44 | 6471.0 | 7609076.0 | 2020-05-15 | 23:00:00 |
| 2020-05-16 | A6 | 1198.66 | 1168.84 | 6714.0 | 7615537.0 | 2020-05-16 | 23:45:00 |
| 2020-05-17 | A6 | 1321.74 | 1288.90 | 7867.0 | 7623063.0 | 2020-05-17 | 23:45:00 |
| 2020-05-18 | A6 | 1338.28 | 1304.82 | 5506.0 | 7628372.0 | 2020-05-18 | 23:45:00 |
| 2020-05-19 | A6 | 1191.15 | 1162.60 | 7007.0 | 7635208.0 | 2020-05-19 | 23:45:00 |
In the meantime we perform a resampling to daily values.
| SOURCE_KEY | AC_POWER_B1 | DAILY_YIELD_B1 | AC_POWER_B2 | DAILY_YIELD_B2 | AC_POWER_B3 | DAILY_YIELD_B3 | AC_POWER_B4 | DAILY_YIELD_B4 | AC_POWER_B5 | ... | AC_POWER_B18 | DAILY_YIELD_B18 | AC_POWER_B19 | DAILY_YIELD_B19 | AC_POWER_B20 | DAILY_YIELD_B20 | AC_POWER_B21 | DAILY_YIELD_B21 | AC_POWER_B22 | DAILY_YIELD_B22 | |
|---|---|---|---|---|---|---|---|---|---|---|---|---|---|---|---|---|---|---|---|---|---|
| DATE_TIME | |||||||||||||||||||||
| 2020-06-13 | A6 | 25335.737619 | 6289.0 | 26709.477143 | 6656.0 | 11083.874286 | 2777.0 | 23780.861905 | 5929.0 | 12271.143333 | ... | 25674.705238 | 6393.0 | 24452.712857 | 6127.0 | 25594.784286 | 6375.0 | 12050.146190 | 4753.733333 | 26840.577619 | 6632.000000 |
| 2020-06-14 | A6 | 8699.187619 | 6462.8 | 30086.197619 | 7555.0 | 29967.725238 | 7458.0 | 8224.308095 | 5929.0 | 30276.250000 | ... | 29817.908571 | 7476.0 | 29026.720476 | 7271.0 | 29865.071905 | 7463.0 | 30580.374286 | 7340.000000 | 30088.969524 | 7268.000000 |
| 2020-06-15 | A6 | 9999.450952 | 2304.0 | 25136.361905 | 6307.0 | 24862.382381 | 6207.0 | 8828.071905 | 2199.0 | 25137.901429 | ... | 24135.331905 | 7476.0 | 14716.762381 | 7271.0 | 25122.144286 | 7463.0 | 24835.744286 | 7340.000000 | 25049.489524 | 7412.666667 |
| 2020-06-16 | A6 | 20858.986190 | 5004.0 | 22047.433333 | 5501.0 | 21613.850952 | 5417.0 | 18431.920000 | 4605.0 | 22410.560000 | ... | 21047.911905 | 6060.0 | 20645.132857 | 5161.0 | 22115.009524 | 6274.0 | 21973.627619 | 6200.000000 | 21870.634286 | 6203.200000 |
| 2020-06-17 | A6 | 17780.373333 | 5004.0 | 17274.084286 | 4306.0 | 16787.458571 | 4197.0 | 16119.520000 | 4020.0 | 16991.233333 | ... | 16655.148095 | 4157.0 | 15748.917619 | 3931.0 | 17345.437619 | 4322.0 | 16860.384762 | 5502.000000 | 17278.511429 | 5327.000000 |
5 rows × 45 columns
Plots of the generated and conversed energy (AC) vs. the daily accumulated energy (yield values).

Plant 2 is less productive, perhaps due to smaller size or older panel age.
Anyway, the ambient temperature at plant 2 is a little higher on
average. This has an small negative effect on the solar panels
efficiency.
Also, higher inner temperatures of the inverter, e.g. due to conversion,
may cause the inverters to "derate" sooner than those of plant 1.
derate = to produce less energy thru conversion while being out of manufacturer-intended working range.
N.B.: in topic "Inverter B2" one cause of reduced production will be revealed.
| DC_POWER | AC_POWER | DAILY_YIELD | TOTAL_YIELD | ||
|---|---|---|---|---|---|
| SOURCE_KEY | DATE_TIME | ||||
| A1 | 2020-05-15 00:00:00 | 0.0 | 0.0 | 0.0 | 6259559.0 |
| 2020-05-15 00:15:00 | 0.0 | 0.0 | 0.0 | 6259559.0 | |
| 2020-05-15 00:30:00 | 0.0 | 0.0 | 0.0 | 6259559.0 | |
| 2020-05-15 00:45:00 | 0.0 | 0.0 | 0.0 | 6259559.0 | |
| 2020-05-15 01:00:00 | 0.0 | 0.0 | 0.0 | 6259559.0 | |
| ... | ... | ... | ... | ... | ... |
| A6 | 2020-06-17 22:45:00 | 0.0 | 0.0 | 6007.0 | 7456208.0 |
| 2020-06-17 23:00:00 | 0.0 | 0.0 | 6007.0 | 7456208.0 | |
| 2020-06-17 23:15:00 | 0.0 | 0.0 | 6007.0 | 7456208.0 | |
| 2020-06-17 23:30:00 | 0.0 | 0.0 | 6007.0 | 7456208.0 | |
| 2020-06-17 23:45:00 | 0.0 | 0.0 | 6007.0 | 7456208.0 |
68778 rows × 4 columns
We can notice about 10 days with yield drops from top to bottom.

we take a quick look at some inverters...

| DATE_TIME | SOURCE_KEY | DC_POWER | AC_POWER | DAILY_YIELD | TOTAL_YIELD | Age | DATE | TIME | |
|---|---|---|---|---|---|---|---|---|---|
| 61898 | 2020-06-14 17:15:00 | A10 | 1671.000000 | 163.812500 | 7327.250000 | 7254506.250 | 0.924515 | 2020-06-14 | 2020-06-14 |
| 63174 | 2020-06-15 07:45:00 | A10 | 3656.857143 | 359.014286 | 262.142857 | 7254846.143 | 0.924559 | 2020-06-15 | 2020-06-15 |
| 65440 | 2020-06-16 09:30:00 | A10 | 7635.714286 | 747.514286 | 1238.428571 | 7262553.429 | 0.925541 | 2020-06-16 | 2020-06-16 |
| 54550 | 2020-06-11 05:45:00 | A10 | 0.000000 | 0.000000 | 0.000000 | 7227367.000 | 0.921057 | 2020-06-11 | 2020-06-11 |
| 62998 | 2020-06-15 05:45:00 | A10 | 0.000000 | 0.000000 | 0.000000 | 7254584.000 | 0.924525 | 2020-06-15 | 2020-06-15 |
| 26222 | 2020-05-28 09:00:00 | A10 | 8462.857143 | 828.185714 | 1128.857143 | 7125666.857 | 0.908096 | 2020-05-28 | 2020-05-28 |
| 55540 | 2020-06-11 17:00:00 | A10 | 2326.571429 | 228.114286 | 5464.428571 | 7232831.429 | 0.921753 | 2020-06-11 | 2020-06-11 |
| 24324 | 2020-05-27 10:45:00 | A10 | 7150.250000 | 699.700000 | 2405.250000 | 7120285.250 | 0.907410 | 2020-05-27 | 2020-05-27 |
| 2728 | 2020-05-16 10:45:00 | A10 | 9953.125000 | 972.887500 | 2217.000000 | 7037032.000 | 0.896800 | 2020-05-16 | 2020-05-16 |
| 48456 | 2020-06-08 08:30:00 | A10 | 5546.625000 | 543.737500 | 562.250000 | 7205244.250 | 0.918237 | 2020-06-08 | 2020-06-08 |

This is an attempt to get an estimate of inverter ages. This effort will soon turn out to be very difficult, impossible, as the plant 2 total yield values are more than 1000 times that of plant 1. So you start inspecting everything and everywhere. Hence the title had become obsolete.
7846821.0 2247916295.0 Ratio: 0.003
7846821.0 8092498.662 Ratio: 0.97


2025.5332909676324
3199.7117604642003
| SOURCE_KEY | DAILY_YIELD | |
|---|---|---|
| DATE | ||
| 2020-05-15 | B1 | 4201.000000 |
| 2020-05-15 | B10 | 9119.000000 |
| 2020-05-15 | B11 | 5560.533333 |
| 2020-05-15 | B12 | 4239.000000 |
| 2020-05-15 | B13 | 4371.733333 |
| ... | ... | ... |
| 2020-06-17 | B5 | 4251.000000 |
| 2020-06-17 | B6 | 3968.000000 |
| 2020-06-17 | B7 | 4121.000000 |
| 2020-06-17 | B8 | 4441.000000 |
| 2020-06-17 | B9 | 4239.000000 |
716 rows × 2 columns
| SOURCE_KEY | DAILY_YIELD | |
|---|---|---|
| DATE | ||
| 2020-05-15 | A1 | 5753.142857 |
| 2020-05-15 | A10 | 6141.125000 |
| 2020-05-15 | A11 | 6302.857143 |
| 2020-05-15 | A12 | 6259.571429 |
| 2020-05-15 | A13 | 6382.125000 |
| ... | ... | ... |
| 2020-06-17 | A25 | 5885.857143 |
| 2020-06-17 | A3 | 6051.571429 |
| 2020-06-17 | A4 | 5856.000000 |
| 2020-06-17 | A5 | 5991.000000 |
| 2020-06-17 | A6 | 6006.428571 |
748 rows × 2 columns

| SOURCE_KEY | TOTAL_YIELDkWh | |
|---|---|---|
| DATE | ||
| 2020-05-15 | B1 | 8.759563e+03 |
| 2020-05-15 | B10 | 4.854096e+06 |
| 2020-05-15 | B11 | 3.018340e+06 |
| 2020-05-15 | B12 | 1.186248e+06 |
| 2020-05-15 | B13 | 5.083533e+06 |
| ... | ... | ... |
| 2020-06-17 | B5 | 7.266623e+04 |
| 2020-06-17 | B6 | 6.462417e+06 |
| 2020-06-17 | B7 | 1.018040e+06 |
| 2020-06-17 | B8 | 9.660064e+03 |
| 2020-06-17 | B9 | 4.022855e+05 |
716 rows × 2 columns

Generator 1 has step by step increases in yields.
A conversion of the total yield values had to be done in order to get values which we can compare.
Blibs in yield values are seen everywhere, and they range in size and duration. Let's see what happens if we take date_time for finer timing...

Inverter B14 has some very odd behavior concerning total yield values:
Moreover, several other inverters of this plant deliver non consistent total yield values. See inverter B2 f.i.
I start to suspect this plant has some systemic issue, which was not disclosed by the donor of the dataset.

The
total yields values are supposed only to increase in time, not to
decrease. But during the heat of the day, this is indeed what happens to
B2.
In the plot the yield starts to drop above 52°C, and power generation
stops soon after this, even before reaching 55°C.
On some panel data sheets you can find the I V-curves: current against
voltage curve. The current stays high and constant, a horizontal line,
but above say 30V, current will quickly drop to 0. Now as , power will be 0.


The fluctuations have a negative impact on the average yield of plant 2.
0.4534437633686215
0.5236844125145991
therefore we need merged data:
2733618.7905902476
4232.128322922962
Index(['B1', 'B10', 'B11', 'B12', 'B13', 'B14', 'B16', 'B17', 'B2', 'B20',
'B22', 'B3', 'B4', 'B8'],
dtype='object', name='SOURCE_KEY')
| Min | mean | Max | size | |
|---|---|---|---|---|
| SOURCE_KEY | ||||
| B1 | 52.901754 | 56.412714 | 59.877592 | 3.0 |
| B10 | 52.901754 | 57.357520 | 60.191938 | 4.0 |
| B11 | 52.901754 | 56.412714 | 59.877592 | 3.0 |
| B12 | 51.327438 | 57.441499 | 62.576479 | 6.0 |
| B13 | 52.901754 | 57.357520 | 60.191938 | 4.0 |
| B14 | 65.545714 | 65.545714 | 65.545714 | 1.0 |
| B16 | 52.901754 | 56.412714 | 59.877592 | 3.0 |
| B17 | 52.901754 | 56.412714 | 59.877592 | 3.0 |
| B2 | 52.901754 | 58.751487 | 65.545714 | 8.0 |
| B20 | 52.901754 | 56.412714 | 59.877592 | 3.0 |
| B22 | 52.901754 | 57.357520 | 60.191938 | 4.0 |
| B3 | 51.327438 | 52.245686 | 53.163934 | 2.0 |
| B4 | 51.327438 | 54.960534 | 60.390231 | 3.0 |
| B8 | 52.901754 | 56.412714 | 59.877592 | 3.0 |

B14 is again the odd duck as this inverter amount of yield values is much higher.
But perhaps it is caused by the fact that this inverter is the last man standing.
Now the groups deployed in the plant 2 formation have appeared:
We filter out records with panel temperatures above 50°, daily yields less than average AND ac current (power) isnot 0.
| Min | mean | Max | size | |
|---|---|---|---|---|
| SOURCE_KEY | ||||
| B1 | 50.190043 | 54.136897 | 62.169260 | 106.0 |
| B10 | 50.016386 | 54.215431 | 64.142721 | 108.0 |
| B11 | 50.199417 | 54.431433 | 63.827184 | 107.0 |
| B12 | 50.190043 | 55.132055 | 66.016279 | 163.0 |
| B13 | 50.117131 | 54.232596 | 63.827184 | 123.0 |
| B14 | 50.016386 | 53.853931 | 63.827184 | 106.0 |
| B15 | 50.199417 | 54.308290 | 63.827184 | 49.0 |
| B16 | 50.199417 | 54.212093 | 63.827184 | 113.0 |
| B17 | 50.016386 | 54.294912 | 66.016279 | 111.0 |
| B18 | 50.199417 | 54.283610 | 62.169260 | 109.0 |
| B19 | 50.010879 | 54.540415 | 63.827184 | 139.0 |
| B2 | 50.190043 | 54.329036 | 64.142721 | 115.0 |
| B20 | 50.199417 | 53.916524 | 63.092099 | 109.0 |
| B21 | 50.199417 | 54.430122 | 63.827184 | 49.0 |
| B22 | 50.010879 | 53.567849 | 62.169260 | 117.0 |
| B3 | 50.016386 | 53.992743 | 63.827184 | 120.0 |
| B4 | 50.190043 | 54.930555 | 66.016279 | 141.0 |
| B5 | 50.199417 | 54.430122 | 63.827184 | 49.0 |
| B6 | 50.016386 | 54.092824 | 66.016279 | 112.0 |
| B7 | 50.199417 | 54.242069 | 63.827184 | 128.0 |
| B8 | 50.199417 | 53.867146 | 62.169260 | 112.0 |
| B9 | 50.199417 | 54.352962 | 63.827184 | 50.0 |

Above average alerts are coming from inverters B12,B19, B4, B7, B13 and perhaps B3. These are good candidates for inspection and replacement.
| SOURCE_KEY_x | AMBIENT_TEMPERATURE | MODULE_TEMPERATURE | IRRADIATION | DATE_TIME | SOURCE_KEY_y | DC_POWER | AC_POWER | DAILY_YIELD | TOTAL_YIELD | TOTAL_YIELDkWh | DATE | TIME | |
|---|---|---|---|---|---|---|---|---|---|---|---|---|---|
| 16056 | iq8k7ZNt4Mwm3w0 | 29.826199 | 45.578350 | 0.588920 | 2020-05-23 08:45:00 | B18 | 788.420000 | 771.780000 | 954.266667 | 3.844583e+05 | 1.384050e+03 | 2020-05-23 | 08:45:00 |
| 2047 | iq8k7ZNt4Mwm3w0 | 26.951768 | 25.081197 | 0.000000 | 2020-05-15 23:30:00 | B2 | 0.000000 | 0.000000 | 3214.000000 | 1.215282e+09 | 4.375015e+06 | 2020-05-15 | 23:30:00 |
| 14816 | iq8k7ZNt4Mwm3w0 | 36.482901 | 53.358576 | 0.566236 | 2020-05-22 15:30:00 | B20 | 847.480000 | 829.073333 | 2056.533333 | 2.264274e+06 | 8.151385e+03 | 2020-05-22 | 15:30:00 |
| 14939 | iq8k7ZNt4Mwm3w0 | 36.578305 | 40.440851 | 0.185470 | 2020-05-22 17:15:00 | B17 | 284.713333 | 279.453333 | 9595.000000 | 1.708128e+09 | 6.149263e+06 | 2020-05-22 | 17:15:00 |
| 30425 | iq8k7ZNt4Mwm3w0 | 27.383969 | 29.679153 | 0.111025 | 2020-05-31 07:45:00 | B18 | 170.440000 | 166.726667 | 189.333333 | 4.381413e+05 | 1.577309e+03 | 2020-05-31 | 07:45:00 |
| 13902 | iq8k7ZNt4Mwm3w0 | 24.281303 | 22.438980 | 0.000000 | 2020-05-22 03:00:00 | B3 | 0.000000 | 0.000000 | 0.000000 | 2.247770e+09 | 8.091972e+06 | 2020-05-22 | 03:00:00 |
| 28896 | iq8k7ZNt4Mwm3w0 | 36.025649 | 50.678597 | 0.750488 | 2020-05-30 14:30:00 | B7 | 1029.406667 | 1006.386667 | 5910.000000 | 2.827038e+08 | 1.017734e+06 | 2020-05-30 | 14:30:00 |
| 13310 | iq8k7ZNt4Mwm3w0 | 32.057482 | 29.994094 | 0.000276 | 2020-05-21 18:45:00 | B6 | 0.000000 | 0.000000 | 4794.000000 | 1.794991e+09 | 6.461968e+06 | 2020-05-21 | 18:45:00 |
| 6055 | iq8k7ZNt4Mwm3w0 | 28.496802 | 27.806913 | 0.000000 | 2020-05-17 21:00:00 | B6 | 0.000000 | 0.000000 | 5519.000000 | 1.794976e+09 | 6.461913e+06 | 2020-05-17 | 21:00:00 |
| 20132 | iq8k7ZNt4Mwm3w0 | 36.003799 | 35.963227 | 0.029605 | 2020-05-25 17:30:00 | B6 | 47.792857 | 46.235714 | 4925.357143 | 1.795013e+09 | 6.462048e+06 | 2020-05-25 | 17:30:00 |
| 9778 | iq8k7ZNt4Mwm3w0 | 33.234345 | 40.042912 | 0.233403 | 2020-05-19 15:15:00 | B11 | 371.513333 | 364.493333 | 1758.200000 | 8.384526e+08 | 3.018429e+06 | 2020-05-19 | 15:15:00 |
| 29994 | iq8k7ZNt4Mwm3w0 | 25.993267 | 23.685736 | 0.000000 | 2020-05-31 03:00:00 | B5 | 0.000000 | 0.000000 | 0.000000 | 2.007135e+07 | 7.225687e+04 | 2020-05-31 | 03:00:00 |
| 11443 | iq8k7ZNt4Mwm3w0 | 32.672186 | 34.304396 | 0.111523 | 2020-05-20 17:45:00 | B6 | 161.126667 | 157.513333 | 4531.133333 | 1.794986e+09 | 6.461951e+06 | 2020-05-20 | 17:45:00 |
| 422 | iq8k7ZNt4Mwm3w0 | 25.230932 | 24.436904 | 0.000000 | 2020-05-15 04:45:00 | B5 | 0.000000 | 0.000000 | 0.000000 | 1.994153e+07 | 7.178949e+04 | 2020-05-15 | 04:45:00 |
| 1107 | iq8k7ZNt4Mwm3w0 | 35.966358 | 58.888153 | 0.956238 | 2020-05-15 12:30:00 | B8 | 1263.453333 | 1231.860000 | 5338.066667 | 2.458984e+06 | 8.852343e+03 | 2020-05-15 | 12:30:00 |
some normal behavior is here expected
| Min | mean | Max | |
|---|---|---|---|
| SOURCE_KEY | |||
| A1 | 52.901754 | 58.553722 | 63.341829 |
| A10 | 52.901754 | 57.596101 | 60.191938 |
| A11 | 52.901754 | 57.596101 | 60.191938 |
| A12 | 52.901754 | 57.596101 | 60.191938 |
| A13 | 52.901754 | 57.596101 | 60.191938 |
| A14 | 52.901754 | 58.553722 | 63.341829 |
| A15 | 52.901754 | 57.596101 | 60.191938 |
| A16 | 52.901754 | 57.596101 | 60.191938 |
| A17 | 52.901754 | 57.596101 | 60.191938 |
| A18 | 52.901754 | 58.553722 | 63.341829 |
| A19 | 52.901754 | 57.596101 | 60.191938 |
| A2 | 52.901754 | 57.596101 | 60.191938 |
| A20 | 52.901754 | 57.596101 | 60.191938 |
| A21 | 52.901754 | 57.596101 | 60.191938 |
| A22 | 52.901754 | 57.596101 | 60.191938 |
| A23 | 52.901754 | 57.596101 | 60.191938 |
| A24 | 52.901754 | 57.596101 | 60.191938 |
| A25 | 52.901754 | 57.596101 | 60.191938 |
| A3 | 52.901754 | 57.596101 | 60.191938 |
| A4 | 52.901754 | 57.596101 | 60.191938 |
| A5 | 52.901754 | 57.596101 | 60.191938 |
| A6 | 52.901754 | 57.596101 | 60.191938 |

In the heatmap the endurance of A1 and A14 was visible by their bright timetrack, and now inverter 18 may join them.
bagger.index.value_counts()
mei23B_merg.index.value_counts()
| Min | mean | Max | |
|---|---|---|---|
| SOURCE_KEY | |||
| B1 | 52.901754 | 54.680275 | 56.458795 |
| B10 | 52.901754 | 56.412714 | 59.877592 |
| B11 | 52.901754 | 54.680275 | 56.458795 |
| B12 | 51.327438 | 57.441499 | 62.576479 |
| B13 | 52.901754 | 56.412714 | 59.877592 |
| B14 | 65.545714 | 65.545714 | 65.545714 |
| B16 | 52.901754 | 54.680275 | 56.458795 |
| B17 | 52.901754 | 54.680275 | 56.458795 |
| B2 | 52.901754 | 57.746355 | 65.545714 |
| B20 | 52.901754 | 54.680275 | 56.458795 |
| B22 | 52.901754 | 56.412714 | 59.877592 |
| B3 | 51.327438 | 52.245686 | 53.163934 |
| B4 | 51.327438 | 54.960534 | 60.390231 |
| B8 | 52.901754 | 54.680275 | 56.458795 |
| DC_POWER | AC_POWER | DAILY_YIELD | TOTAL_YIELD | Age | |
|---|---|---|---|---|---|
| count | 68778.000000 | 68778.000000 | 68778.000000 | 6.877800e+04 | 68778.000000 |
| mean | 3147.426211 | 307.802752 | 3295.968737 | 6.978712e+06 | 0.889368 |
| std | 4036.457169 | 394.396439 | 3145.178309 | 4.162720e+05 | 0.053050 |
| min | 0.000000 | 0.000000 | 0.000000 | 6.183645e+06 | 0.788045 |
| 25% | 0.000000 | 0.000000 | 0.000000 | 6.512003e+06 | 0.829891 |
| 50% | 429.000000 | 41.493750 | 2658.714286 | 7.146685e+06 | 0.910775 |
| 75% | 6366.964286 | 623.618750 | 6274.000000 | 7.268706e+06 | 0.926325 |
| max | 14471.125000 | 1410.950000 | 9163.000000 | 7.846821e+06 | 1.000000 |
We'll try to have a better view on what is happening by viewing daily data.
There appears to be a 10-fold error in a series values: DC power for plant 1.
solar1GEN["DC_POWER"] = solar1GEN.DC_POWER/10
solar1GENdt["DC_POWER"]= solar1GENdt.DC_POWER/10
| DC_POWER | AC_POWER | DAILY_YIELD | TOTAL_YIELD | Effic | |
|---|---|---|---|---|---|
| DATE_TIME | |||||
| 2020-06-03 | 673259.126787 | 658508.402385 | 7836.000 | 7263053.0 | 0.978091 |
| 2020-06-04 | 732103.145830 | 715775.188695 | 0.000 | 7271273.0 | 0.977697 |
| 2020-06-05 | 689847.383342 | 674574.155957 | 7817.000 | 7279090.0 | 0.977860 |
| 2020-06-06 | 573093.850002 | 560332.525003 | 0.000 | 7285530.0 | 0.977733 |
| 2020-06-07 | 687644.416068 | 672139.494642 | 8260.000 | 7293790.0 | 0.977452 |
| 2020-06-08 | 747011.506309 | 730087.464754 | 8377.000 | 7302167.0 | 0.977344 |
| 2020-06-09 | 723400.889295 | 707237.483924 | 8289.000 | 7310456.0 | 0.977656 |
| 2020-06-10 | 578403.952144 | 565937.491073 | 6560.000 | 7317016.0 | 0.978447 |
| 2020-06-11 | 504567.857143 | 494174.862501 | 4962.125 | 7322687.0 | 0.979402 |
| 2020-06-12 | 522235.391071 | 511289.694645 | 5863.000 | 7328550.0 | 0.979041 |
| 2020-06-13 | 759377.626784 | 742032.653569 | 8410.000 | 7336960.0 | 0.977159 |
| 2020-06-14 | 635049.458932 | 621509.294643 | 7320.000 | 7344280.0 | 0.978679 |
| 2020-06-15 | 605553.591075 | 592483.864289 | 6820.000 | 7351100.0 | 0.978417 |
| 2020-06-16 | 557250.126388 | 545506.678770 | 5479.250 | 7357362.0 | 0.978926 |
| 2020-06-17 | 531777.982146 | 520383.536430 | 5910.000 | 7363272.0 | 0.978573 |
Conversion efficiency of 98% seems ok to me.


| DC_POWER | AC_POWER | DAILY_YIELD | TOTAL_YIELD | Effic | |
|---|---|---|---|---|---|
| DATE_TIME | |||||
| 2020-06-13 | 455305.790476 | 445507.764286 | 6632.0 | 209312200.0 | 0.978480 |
| 2020-06-14 | 505911.451905 | 495073.503333 | 7268.0 | 209319687.0 | 0.978577 |
| 2020-06-15 | 410998.909524 | 402322.124286 | 6083.0 | 209325949.0 | 0.978889 |
| 2020-06-16 | 480810.068571 | 470830.427143 | 5327.0 | 209331425.0 | 0.979244 |
| 2020-06-17 | 380211.240476 | 372436.317143 | 4316.0 | 209335741.0 | 0.979551 |

When I bring these values to the same scale, it is obvious that the
generated energy is faulty picked up by the inverter. The daily yields
for plant 2 are lower than what we could expect from its generated ac
currents.
Does the circuit lose energy somewhere? Maybe something else is wrong? Hardware or software?
we focus on what happens on a "warmer" day
| DATE_TIME | SOURCE_KEY | DC_POWER | AC_POWER | DAILY_YIELD | TOTAL_YIELD | DATE | TIME | |
|---|---|---|---|---|---|---|---|---|
| 15632 | 2020-05-23 06:45:00 | A1 | 61.150000 | 59.200000 | 23.166667 | 6312460.167 | 2020-05-23 | 06:45:00 |
| 15654 | 2020-05-23 07:00:00 | A1 | 95.637500 | 92.887500 | 41.125000 | 6312478.125 | 2020-05-23 | 07:00:00 |
| 15676 | 2020-05-23 07:15:00 | A1 | 198.742857 | 194.685714 | 74.571429 | 6312511.571 | 2020-05-23 | 07:15:00 |
| 15698 | 2020-05-23 07:30:00 | A1 | 298.387500 | 292.900000 | 137.375000 | 6312574.375 | 2020-05-23 | 07:30:00 |
| 15720 | 2020-05-23 07:45:00 | A1 | 343.885714 | 338.057143 | 216.000000 | 6312653.000 | 2020-05-23 | 07:45:00 |

The Inverters cannot keep up the conversion of dc current to ac current when a certain amount of DC current - or amount of energy - has been generated. Inhibitors can be solar panel temperature, inner Inverter temperature, which are a function of the ambient temperature, the device material properties, sufficient ventilation and sufficient cover against direct sunlight.
extract AC current, max. daily yield:
| DATE_TIME | SOURCE_KEY | DC_POWER | AC_POWER | DAILY_YIELD | TOTAL_YIELD | DATE | TIME | |
|---|---|---|---|---|---|---|---|---|
| 15632 | 2020-05-23 06:45:00 | A1 | 61.150000 | 59.200000 | 23.166667 | 6312460.167 | 2020-05-23 | 06:45:00 |
| 15654 | 2020-05-23 07:00:00 | A1 | 95.637500 | 92.887500 | 41.125000 | 6312478.125 | 2020-05-23 | 07:00:00 |
| 15676 | 2020-05-23 07:15:00 | A1 | 198.742857 | 194.685714 | 74.571429 | 6312511.571 | 2020-05-23 | 07:15:00 |
| 15698 | 2020-05-23 07:30:00 | A1 | 298.387500 | 292.900000 | 137.375000 | 6312574.375 | 2020-05-23 | 07:30:00 |
| 15720 | 2020-05-23 07:45:00 | A1 | 343.885714 | 338.057143 | 216.000000 | 6312653.000 | 2020-05-23 | 07:45:00 |
| ... | ... | ... | ... | ... | ... | ... | ... | ... |
| 16621 | 2020-05-23 17:45:00 | A24 | 159.328571 | 156.028571 | 8477.000000 | 7180771.000 | 2020-05-23 | 17:45:00 |
| 16643 | 2020-05-23 18:00:00 | A24 | 131.837500 | 128.500000 | 8513.375000 | 7180807.375 | 2020-05-23 | 18:00:00 |
| 16665 | 2020-05-23 18:15:00 | A24 | 58.071429 | 56.257143 | 8537.285714 | 7180831.286 | 2020-05-23 | 18:15:00 |
| 16687 | 2020-05-23 18:30:00 | A24 | 3.400000 | 3.275000 | 8543.875000 | 7180837.875 | 2020-05-23 | 18:30:00 |
| 16709 | 2020-05-23 18:45:00 | A24 | 0.000000 | 0.000000 | 8544.000000 | 7180838.000 | 2020-05-23 | 18:45:00 |
1078 rows × 8 columns
| SOURCE_KEY | A1 | A10 | A11 | A12 | A13 | A14 | A15 | A16 | A17 | A18 | ... | A20 | A21 | A22 | A23 | A24 | A25 | A3 | A4 | A5 | A6 |
|---|---|---|---|---|---|---|---|---|---|---|---|---|---|---|---|---|---|---|---|---|---|
| DATE_TIME | |||||||||||||||||||||
| 2020-05-23 06:45:00 | 59.200000 | 65.250000 | 65.300000 | 65.516667 | 67.866667 | 58.433333 | 66.200000 | 64.200000 | 65.383333 | 57.950000 | ... | 65.883333 | 63.383333 | 63.500000 | 66.300000 | 65.950000 | 66.583333 | 65.333333 | 64.340000 | 65.880000 | 65.520000 |
| 2020-05-23 07:00:00 | 92.887500 | 100.457143 | 99.462500 | 99.514286 | 104.042857 | 92.462500 | 99.985714 | 97.537500 | 99.014286 | 88.057143 | ... | 99.700000 | 99.112500 | 99.012500 | 100.928571 | 99.428571 | 100.557143 | 100.871429 | 98.950000 | 100.075000 | 100.500000 |
| 2020-05-23 07:15:00 | 194.685714 | 208.600000 | 182.857143 | 198.000000 | 216.525000 | 191.985714 | 199.800000 | 202.714286 | 204.625000 | 181.800000 | ... | 208.900000 | 207.600000 | 209.600000 | 199.557143 | 209.487500 | 202.100000 | 210.225000 | 203.514286 | 210.328571 | 207.800000 |
| 2020-05-23 07:30:00 | 292.900000 | 321.514286 | 315.587500 | 309.700000 | 334.042857 | 290.737500 | 314.412500 | 309.375000 | 318.471429 | 281.557143 | ... | 321.785714 | 313.750000 | 315.400000 | 315.600000 | 319.057143 | 312.575000 | 326.585714 | 315.700000 | 319.587500 | 320.575000 |
| 2020-05-23 07:45:00 | 338.057143 | 391.587500 | 364.171429 | 361.771429 | 408.012500 | 338.957143 | 364.528571 | 357.357143 | 361.650000 | 318.971429 | ... | 364.462500 | 354.842857 | 354.271429 | 364.414286 | 364.114286 | 364.457143 | 401.162500 | 378.485714 | 365.171429 | 382.814286 |
5 rows × 22 columns


Cleaning up the night time hours for nicer heatmap.
datetime.time(6, 0)
Some Nans are caused by pivoting the dataframe. In fact, there was simply no data for that Inverter in that timeslot.
| SOURCE_KEY | A1 | A10 | A11 | A12 | A13 | A14 | A15 | A16 | A17 | A18 | ... | A20 | A21 | A22 | A23 | A24 | A25 | A3 | A4 | A5 | A6 |
|---|---|---|---|---|---|---|---|---|---|---|---|---|---|---|---|---|---|---|---|---|---|
| DATE_TIME | |||||||||||||||||||||
| 2020-06-17 17:45:00 | 85.271429 | 91.171429 | 92.114286 | 91.057143 | 95.414286 | 84.557143 | 92.914286 | 90.342857 | 93.100000 | 93.385714 | ... | 94.971429 | 92.042857 | 92.714286 | 90.300000 | 93.142857 | 91.900000 | 92.571429 | 90.928571 | 94.185714 | 92.828571 |
| 2020-06-17 18:00:00 | 54.614286 | 59.414286 | 58.628571 | 58.085714 | 62.614286 | 54.157143 | 58.757143 | 57.371429 | 58.742857 | 59.300000 | ... | 59.614286 | 58.142857 | 57.885714 | 57.528571 | 58.414286 | 58.385714 | 60.185714 | 58.700000 | 58.957143 | 59.757143 |
| 2020-06-17 18:15:00 | 30.412500 | 32.425000 | 32.737500 | 32.500000 | 34.987500 | 30.062500 | 32.912500 | 32.300000 | 32.525000 | 33.150000 | ... | 33.500000 | 32.600000 | 32.800000 | 32.137500 | 32.862500 | 32.775000 | 33.000000 | 32.700000 | 33.237500 | 33.362500 |
| 2020-06-17 18:30:00 | 6.985714 | 7.228571 | 7.342857 | 7.300000 | 9.457143 | 6.771429 | 7.328571 | 7.285714 | 7.242857 | 7.585714 | ... | 7.614286 | 7.300000 | 7.471429 | 7.228571 | 7.485714 | 7.485714 | 7.557143 | 7.514286 | 7.585714 | 7.614286 |
| 2020-06-17 18:45:00 | 0.000000 | 0.000000 | 0.000000 | 0.000000 | 0.000000 | 0.000000 | 0.000000 | 0.000000 | 0.000000 | 0.000000 | ... | 0.000000 | 0.000000 | 0.000000 | 0.000000 | 0.000000 | 0.000000 | 0.000000 | 0.000000 | 0.000000 | 0.000000 |
5 rows × 22 columns

Circuits A1 and A14 are always in service, it seems, while the rest is split up in 2 groups (8 and 12). These groups appear to work, or fall out, in turn. Take a look at these inverters: A5,A11, A12,A14,A16, A18,A19,A21, A22,A25.
It is known that solar panel efficiency is related to its placement,
angle, and the sun's position. And high temperatures are known to
reduce efficiency.
As I noticed the solar panel inverter temperatures can reach 65°C, I
suspect that overheated ones reduce or stop producing when a certain
threshold is reached.
We can spot 10 days where group outages occur:
2020-05-15,2020-05-19,2020-05-21,2020-05-22,2020-05-27,
2020-05-29,2020-06-02, 2020-06-04, 2020-06-05, 2020-06-06. We'll use
this selection also for plant 2.
| SOURCE_KEY_x | AMBIENT_TEMPERATURE | MODULE_TEMPERATURE | IRRADIATION | SOURCE_KEY_y | DC_POWER | AC_POWER | DAILY_YIELD | TOTAL_YIELD | DATE | TIME | |
|---|---|---|---|---|---|---|---|---|---|---|---|
| DATE_TIME | |||||||||||
| 2020-06-05 15:30:00 | HmiyD2TTLFNqkNe | 28.671004 | 38.059052 | 0.330956 | A5 | 4334.714286 | 424.514286 | 6599.000000 | 7323360.000 | 2020-06-05 | 15:30:00 |
| 2020-06-04 17:00:00 | HmiyD2TTLFNqkNe | 27.408914 | 33.942008 | 0.296628 | A21 | 4241.000000 | 416.571429 | 7934.285714 | 6938710.286 | 2020-06-04 | 17:00:00 |
| 2020-05-22 07:00:00 | HmiyD2TTLFNqkNe | 23.433872 | 24.744895 | 0.110892 | A12 | 1505.857143 | 147.042857 | 84.142857 | 7146769.143 | 2020-05-22 | 07:00:00 |
| 2020-06-06 11:00:00 | HmiyD2TTLFNqkNe | 29.041046 | 52.912862 | 0.833717 | A12 | 10900.714290 | 1064.285714 | 2624.857143 | 7261699.857 | 2020-06-06 | 11:00:00 |
| 2020-06-02 20:15:00 | HmiyD2TTLFNqkNe | 23.695445 | 21.070044 | 0.000000 | A11 | 0.000000 | 0.000000 | 0.000000 | 6662968.000 | 2020-06-02 | 20:15:00 |
| 2020-06-04 08:00:00 | HmiyD2TTLFNqkNe | 24.827956 | 34.912203 | 0.353618 | A14 | 4815.714286 | 472.457143 | 348.285714 | 6453072.286 | 2020-06-04 | 08:00:00 |
| 2020-05-27 12:30:00 | HmiyD2TTLFNqkNe | 32.095951 | 51.931612 | 0.574869 | A18 | 8738.125000 | 853.800000 | 3957.125000 | 7203826.125 | 2020-05-27 | 12:30:00 |
| 2020-06-06 09:30:00 | HmiyD2TTLFNqkNe | 26.816633 | 41.406572 | 0.684166 | A18 | 8931.000000 | 873.700000 | 1292.428571 | 7274382.429 | 2020-06-06 | 09:30:00 |
| 2020-05-29 07:45:00 | HmiyD2TTLFNqkNe | 22.345734 | 28.182127 | 0.188820 | A22 | 2707.000000 | 265.500000 | 251.000000 | 7112613.000 | 2020-05-29 | 07:45:00 |
| 2020-05-29 10:15:00 | HmiyD2TTLFNqkNe | 27.280599 | 56.176178 | 0.922472 | A14 | 11125.375000 | 1085.487500 | 1676.000000 | 6415261.000 | 2020-05-29 | 10:15:00 |
| 2020-05-19 10:15:00 | HmiyD2TTLFNqkNe | 27.712921 | 43.051187 | 0.592494 | A11 | 7433.625000 | 726.937500 | 1520.250000 | 6549682.250 | 2020-05-19 | 10:15:00 |
| 2020-06-06 15:30:00 | HmiyD2TTLFNqkNe | 26.587683 | 34.348906 | 0.288334 | A21 | 4288.714286 | 421.042857 | 5962.857143 | 6952731.857 | 2020-06-06 | 15:30:00 |


Note the many dark points for high current above 55°C.

..., but we keep all inverters


Compared to plant 1, there are no so many dark spots above 55° for plant 2. Daily yields are even more depressed. Let's produce a heatmap of plant 2.

Outages are more obvious at plant 2. Inverters B15, B21, B5 and B9 appear to stop working together, so they might be connected to the same group of solar panels. Another group with similar behavior are B14,B18,B19, B3,B4,B6 and B7.

From 10 AM onwards, the yield tries to follow the (amount of produced) DC current, but above 210 =52.5 °C panel temperature, the difference in height btw. DC and yield widens. The yield curve stays behind the DC curve. From this point on, the DC - AC conversion, panel temperature, or whatever ... is no longer optimal. The system seems to normalize again after inner temperature falling below 50°C.
| AMB_rol4 | MOD_rol4 | D_Y_rol4 | AC_rol4 | DC_rol4 | |
|---|---|---|---|---|---|
| DATE_TIME | |||||
| 2020-06-06 11:45:00 | 116.175479 | 172.680915 | -99.321429 | 2.076898e+03 | 2.123029e+04 |
| 2020-06-05 20:00:00 | 97.607247 | 86.438399 | 7739.000000 | -1.117151e-11 | 8.412826e-11 |
| 2020-06-05 01:00:00 | 89.562964 | 79.481885 | 0.000000 | -1.576250e-11 | 6.179590e-11 |
| 2020-06-06 01:00:00 | 88.903462 | 78.057799 | 0.000000 | -1.117151e-11 | 8.412826e-11 |
| 2020-06-05 00:15:00 | 89.883819 | 79.526589 | 0.000000 | -1.576250e-11 | 6.179590e-11 |
| 2020-06-02 14:00:00 | 109.049919 | 173.967261 | 96.178571 | 2.577670e+03 | 2.631536e+04 |
| SOURCE_KEY_x | AMBIENT_TEMPERATURE | MODULE_TEMPERATURE | IRRADIATION | SOURCE_KEY_y | DC_POWER | AC_POWER | DAILY_YIELD | TOTAL_YIELD | TOTAL_YIELDkWh | DATE | TIME | AMB_rol4 | MOD_rol4 | D_Y_dif4 | D_Y_rol4 | AC_rol4 | DC_rol4 | |
|---|---|---|---|---|---|---|---|---|---|---|---|---|---|---|---|---|---|---|
| DATE_TIME | ||||||||||||||||||
| 2020-05-19 14:45:00 | HmiyD2TTLFNqkNe | 30.368632 | 50.099892 | 0.702797 | B17 | 495.560000 | 485.340000 | 1589.266667 | 1.708110e+09 | 6.149197e+06 | 2020-05-19 | 14:45:00 | 121.474528 | 200.399568 | -4836.866667 | -4709.466667 | 2.609753e+03 | 2.665273e+03 |
| 2020-06-05 14:15:00 | HmiyD2TTLFNqkNe | 28.863662 | 49.925148 | 0.466440 | B19 | 439.340000 | 431.266667 | 1509.333333 | 1.210810e+08 | 4.358916e+05 | 2020-06-05 | 14:15:00 | 115.454646 | 199.700594 | 129.800000 | -4522.380952 | 1.781047e+03 | 1.814833e+03 |
| 2020-05-19 08:30:00 | HmiyD2TTLFNqkNe | 25.615072 | 33.972492 | 0.297789 | B22 | 465.493333 | 456.686667 | 650.533333 | 2.091608e+08 | 7.529787e+05 | 2020-05-19 | 08:30:00 | 102.460287 | 135.889967 | -42.933333 | -39.600000 | 1.934338e+03 | 1.972275e+03 |
| 2020-05-19 15:45:00 | HmiyD2TTLFNqkNe | 29.761686 | 40.829560 | 0.379866 | B7 | 75.271429 | 73.164286 | 6498.285714 | 2.826275e+08 | 1.017459e+06 | 2020-05-19 | 15:45:00 | 119.046745 | 163.318238 | 4101.857143 | 164.285714 | 3.065000e+02 | 3.152214e+02 |
| 2020-05-21 12:45:00 | HmiyD2TTLFNqkNe | 30.864174 | 51.885671 | 0.746644 | B17 | 0.000000 | 0.000000 | 1783.000000 | 1.708116e+09 | 6.149217e+06 | 2020-05-21 | 12:45:00 | 123.456698 | 207.542684 | -2469.733333 | -227.000000 | 2.556353e+03 | 2.621907e+03 |
| 2020-05-21 22:15:00 | HmiyD2TTLFNqkNe | 24.199050 | 21.674919 | 0.000000 | B20 | 0.000000 | 0.000000 | 9088.000000 | 2.262217e+06 | 8.143981e+03 | 2020-05-21 | 22:15:00 | 96.796200 | 86.699675 | 4413.000000 | 739.000000 | 3.328893e-12 | -1.936229e-11 |

The daily yields (orange) have been multiplied by 2 in this plot, and
currents are 10 times more than those values used in the previous plot
of plant 1.
The panel temperature values (blue) have not been changed, so they
remain at 4 times their real value: 200 in the plot means 50°C in
reality.
| AMB_rol4 | MOD_rol4 | D_Y_rol4 | AC_rol4 | DC_rol4 | |
|---|---|---|---|---|---|
| DATE_TIME | |||||
| 2020-06-06 11:45:00 | 116.175479 | 172.680915 | -99.321429 | 2.076898e+03 | 2.123029e+04 |
| 2020-06-05 20:00:00 | 97.607247 | 86.438399 | 7739.000000 | -1.117151e-11 | 8.412826e-11 |
| 2020-06-05 01:00:00 | 89.562964 | 79.481885 | 0.000000 | -1.576250e-11 | 6.179590e-11 |
| 2020-06-06 01:00:00 | 88.903462 | 78.057799 | 0.000000 | -1.117151e-11 | 8.412826e-11 |
| 2020-06-05 00:15:00 | 89.883819 | 79.526589 | 0.000000 | -1.576250e-11 | 6.179590e-11 |
| 2020-06-02 14:00:00 | 109.049919 | 173.967261 | 96.178571 | 2.577670e+03 | 2.631536e+04 |
Let's try to determine the operational Temperature Coefficient of of 1 module. This coeff. is not the hypothetical one which is determined in STC. Perhaps I'll need more data: all inverters of a complete plant.
Each solar cell technology comes with unique temperature coefficients. These temperature coefficients are important and the temperature of the solar cell has direct influence on the power output of a solar PV module.
Once the temperature a solar module operates in increases, the power output of the solar module will decrease.
Crystalline solar cells are the main cell technology and usually come with a temperature coefficient of the maximum output power of about -0.5% / degree Celsius. However, monocrystalline Si loses much more Power than other PV materials when radiation increases. (See figure below)
The rated power as generally indicated on the module’s label is measured at 25 degrees Celsius, and with any temperature increase above 25°C you have to take into account power losses of 1% for every 2°C increase. This value depends on the PV material.
Most installed solar modules in sunny countries easily reach higher temperatures than 25°C. In fact, temperatures of 50°C and above are easily reached.
When solar panels are exposed to a higher temperature, the current
will increase, while the voltage will decrease. Since voltage decreases
faster than the current increases, you’ll have a lowered efficiency for
your solar panels.

In fact, P, V and current are all 3 depending on temperature:
A. The power from a solar panel drops with temperature and described by
the temperature coefficient of power, typically -0.5%/°C for silicon
solar panels.
B. The current from a solar panel rises slightly (and linearly) with
temperature . There is another temperature coefficient that describes
this, the temperature coefficient for current which for c-Si is
typically +0.034%/°C, so the effect is small.
C. The voltage from a solar panel drops sub-linearly with temperature
giving rise to yet another temperature coefficient for voltage. For c-Si
this is about -0.34%/°C, so the loss in voltage is much larger than the modest gain in current, hence overall loss of power.
Let's take a look at the impact of temperature coefficient of on the data of panels on A12 and the whole A group.
| AMBIENT_TEMPERATURE | MODULE_TEMPERATURE | IRRADIATION | DATE_TIME | SOURCE_KEY | DC_POWER | AC_POWER | DAILY_YIELD | TOTAL_YIELD | DATE | TIME | |
|---|---|---|---|---|---|---|---|---|---|---|---|
| 15839 | 26.854494 | 44.581498 | 0.613795 | 2020-05-23 09:00:00 | A12 | 810.187500 | 792.962500 | 1011.250000 | 7154724.250 | 2020-05-23 | 09:00:00 |
| 15905 | 27.703897 | 45.234833 | 0.710976 | 2020-05-23 09:45:00 | A12 | 951.528571 | 930.142857 | 1629.571429 | 7155342.571 | 2020-05-23 | 09:45:00 |
Temperature Coefficient of P_max: the panel on B10
| AMBIENT_TEMPERATURE | MODULE_TEMPERATURE | IRRADIATION | DATE_TIME | SOURCE_KEY | DC_POWER | AC_POWER | DAILY_YIELD | TOTAL_YIELD | TOTAL_YIELDkWh | DATE | TIME | |
|---|---|---|---|---|---|---|---|---|---|---|---|---|
| 16618 | 38.271593 | 45.333285 | 0.277961 | 2020-05-23 16:45:00 | B1 | 434.566667 | 426.686667 | 9376.600000 | 2.492655e+06 | 8.973557e+03 | 2020-05-23 | 16:45:00 |
| 16619 | 38.271593 | 45.333285 | 0.277961 | 2020-05-23 16:45:00 | B2 | 417.486667 | 410.106667 | 9031.866667 | 1.215327e+09 | 4.375178e+06 | 2020-05-23 | 16:45:00 |
| 16620 | 38.271593 | 45.333285 | 0.277961 | 2020-05-23 16:45:00 | B3 | 419.646667 | 412.213333 | 4240.866667 | 2.247777e+09 | 8.091998e+06 | 2020-05-23 | 16:45:00 |
| 16621 | 38.271593 | 45.333285 | 0.277961 | 2020-05-23 16:45:00 | B4 | 370.166667 | 363.806667 | 4330.066667 | 1.743449e+06 | 6.276417e+03 | 2020-05-23 | 16:45:00 |
| 16622 | 38.271593 | 45.333285 | 0.277961 | 2020-05-23 16:45:00 | B6 | 400.546667 | 393.553333 | 2805.533333 | 1.795003e+09 | 6.462012e+06 | 2020-05-23 | 16:45:00 |
| 16623 | 38.271593 | 45.333285 | 0.277961 | 2020-05-23 16:45:00 | B7 | 414.286667 | 406.980000 | 3087.200000 | 2.826455e+08 | 1.017524e+06 | 2020-05-23 | 16:45:00 |
| 16624 | 38.271593 | 45.333285 | 0.277961 | 2020-05-23 16:45:00 | B8 | 436.320000 | 428.400000 | 9341.133333 | 2.525716e+06 | 9.092578e+03 | 2020-05-23 | 16:45:00 |
| 16625 | 38.271593 | 45.333285 | 0.277961 | 2020-05-23 16:45:00 | B10 | 410.326667 | 403.133333 | 8901.333333 | 1.348404e+09 | 4.854254e+06 | 2020-05-23 | 16:45:00 |
| 16626 | 38.271593 | 45.333285 | 0.277961 | 2020-05-23 16:45:00 | B11 | 429.360000 | 421.606667 | 9287.600000 | 8.384905e+08 | 3.018566e+06 | 2020-05-23 | 16:45:00 |
| 16627 | 38.271593 | 45.333285 | 0.277961 | 2020-05-23 16:45:00 | B12 | 337.186667 | 331.453333 | 3753.466667 | 3.295430e+08 | 1.186355e+06 | 2020-05-23 | 16:45:00 |
| 16628 | 38.271593 | 45.333285 | 0.277961 | 2020-05-23 16:45:00 | B13 | 431.320000 | 423.526667 | 9169.800000 | 1.412149e+09 | 5.083737e+06 | 2020-05-23 | 16:45:00 |
| 16629 | 38.271593 | 45.333285 | 0.277961 | 2020-05-23 16:45:00 | B14 | 428.826667 | 421.086667 | 9281.466667 | 1.817655e+08 | 6.543559e+05 | 2020-05-23 | 16:45:00 |
| 16630 | 38.271593 | 45.333285 | 0.277961 | 2020-05-23 16:45:00 | B16 | 438.080000 | 430.053333 | 9342.133333 | 1.660037e+09 | 5.976135e+06 | 2020-05-23 | 16:45:00 |
| 16631 | 38.271593 | 45.333285 | 0.277961 | 2020-05-23 16:45:00 | B17 | 426.880000 | 419.193333 | 9211.666667 | 1.708138e+09 | 6.149296e+06 | 2020-05-23 | 16:45:00 |
| 16632 | 38.271593 | 45.333285 | 0.277961 | 2020-05-23 16:45:00 | B18 | 406.180000 | 399.073333 | 2958.266667 | 3.864623e+05 | 1.391264e+03 | 2020-05-23 | 16:45:00 |
| 16633 | 38.271593 | 45.333285 | 0.277961 | 2020-05-23 16:45:00 | B19 | 395.486667 | 388.613333 | 2697.800000 | 1.210133e+08 | 4.356477e+05 | 2020-05-23 | 16:45:00 |
| 16634 | 38.271593 | 45.333285 | 0.277961 | 2020-05-23 16:45:00 | B20 | 426.193333 | 418.273333 | 9226.333333 | 2.274625e+06 | 8.188651e+03 | 2020-05-23 | 16:45:00 |
| 16635 | 38.271593 | 45.333285 | 0.277961 | 2020-05-23 16:45:00 | B22 | 423.326667 | 415.793333 | 9074.333333 | 2.091864e+08 | 7.530711e+05 | 2020-05-23 | 16:45:00 |
0.048
0.113
We can plot a curve of dc power i.f.o. panel temperature, in order to inspect how great the impact is of the temp. coefficient:
| AMBIENT_TEMPERATURE | MODULE_TEMPERATURE | IRRADIATION | DATE_TIME | SOURCE_KEY | DC_POWER | AC_POWER | DAILY_YIELD | TOTAL_YIELD | DATE | TIME | |
|---|---|---|---|---|---|---|---|---|---|---|---|
| 30609 | 26.914205 | 23.596804 | 0.000000 | 2020-05-30 19:15:00 | A24 | 0.000000 | 0.000000 | 7290.000000 | 7235977.000 | 2020-05-30 | 19:15:00 |
| 22250 | 29.967765 | 59.424286 | 0.852111 | 2020-05-26 10:45:00 | A5 | 1205.028571 | 1175.771429 | 2852.857143 | 7244501.857 | 2020-05-26 | 10:45:00 |
| 10485 | 22.156954 | 19.550769 | 0.000000 | 2020-05-20 04:15:00 | A12 | 0.000000 | 0.000000 | 0.000000 | 7130332.000 | 2020-05-20 | 04:15:00 |
| 1666 | 27.097548 | 25.200846 | 0.000000 | 2020-05-15 19:15:00 | A1 | 0.000000 | 0.000000 | 5754.000000 | 6265313.000 | 2020-05-15 | 19:15:00 |
| 1693 | 27.018701 | 25.745268 | 0.000125 | 2020-05-15 19:30:00 | A24 | 0.000000 | 0.000000 | 5965.000000 | 7122116.000 | 2020-05-15 | 19:30:00 |
| 9580 | 28.110651 | 29.981213 | 0.087228 | 2020-05-19 17:30:00 | A17 | 128.337500 | 124.837500 | 6909.750000 | 7201320.750 | 2020-05-19 | 17:30:00 |
| 7850 | 23.726550 | 21.563179 | 0.000000 | 2020-05-18 21:00:00 | A3 | 0.000000 | 0.000000 | 5435.000000 | 7013918.000 | 2020-05-18 | 21:00:00 |
| 22164 | 28.379008 | 53.270111 | 0.766008 | 2020-05-26 09:45:00 | A10 | 961.037500 | 939.775000 | 1798.375000 | 7111794.375 | 2020-05-26 | 09:45:00 |
| 14351 | 31.854071 | 57.859224 | 0.814901 | 2020-05-22 13:30:00 | A24 | 1124.771429 | 1097.485714 | 4875.857143 | 7169998.857 | 2020-05-22 | 13:30:00 |
Determining a temperature coefficient with only the data of 1 inverter can provide an idea of its relative condition.
([25, 196.24412698412698, 49.36976799609156, 18], [30, nan, nan, 18], [35, 250.23439153439145, 190.19454369175466, 18], [40, 185.34013227513228, 11.234326944002737, 18], [45, 413.67703703703705, 24.85579995133633, 18], [50, 769.7774603174603, 210.48835493496432, 18], [52, 690.2399999999999, 489.4286474219031, 18], [54, 769.4652380952381, 353.4150816822342, 18], [56, 766.9485661375661, 493.65539153300244, 18], [60, 742.6525925925926, 603.0685881580204, 18], [62, nan, nan, 18])

0.03514255316720065 0.15904966442554153 0.11814146579206262 nan nan 0.1489326287112413
([25, 207.36737013181818, 8.945973447450065, 22], [30, 57.4411525959091, 1.5243245976540596, 22], [35, 280.24155843181813, 12.554421729490477, 22], [40, nan, nan, 22], [45, 867.001582777273, 101.48529299103541, 22], [50, 819.8344967522728, 81.02484361596314, 22], [52, nan, nan, 22], [54, nan, nan, 22], [56, 1164.7641639545454, 97.79862409432143, 22], [60, 1196.0856601515152, 123.37824320983852, 22], [62, nan, nan, 22])

([25, 33.20041276014163, 76.60944163311339, 1158], [30, 172.16531087495633, 133.0012696557939, 458], [35, 365.1063008869085, 151.59522159034557, 634], [40, 519.7205045990909, 140.76996011289648, 440], [45, 688.5505411230303, 163.11876637273184, 330], [50, 856.3690005218856, 165.72382595181134, 594], [52, 976.5465007209594, 136.52346118907715, 396], [54, 940.8784363313638, 205.48448318211612, 660], [56, 1076.6440447312123, 177.54044301641375, 330], [58, 1135.8928064125, 118.1864156333179, 528], [60, 1151.8868756002526, 175.20966860117875, 396], [62, 1132.849981962626, 148.8387707770714, 198], [63, 1201.3645292030305, 115.05110623985671, 132])

3.2868839665613065 3.3857835310502984 3.3760684174029283 2.9401314708891797 2.958287115023496 2.8750048056648847
([25, 9.191062615275614, 31.464618396354027, 2554], [30, 48.31120157384988, 90.22020244441272, 944], [35, 311.2906260733801, 213.5162931744137, 610], [40, 428.62412419938727, 245.17704477327152, 342], [45, 631.5700313283209, 187.1945984360412, 456], [50, 784.9324680603947, 368.4437795404844, 738], [52, 738.8102386595664, 467.1915771983771, 714], [54, 797.6953237514517, 482.95935269496607, 656], [56, 828.3458874458875, 496.9695989705531, 506], [58, 710.5412994350282, 581.921132819501, 354], [60, 674.6348179271708, 579.6319948917937, 170], [62, 769.2954523809524, 513.2075511709162, 160], [63, 838.214592261905, 531.2389623495206, 160])

84.78216969400661 % 30.435660611986776
On average, solar panels degrade at a rate of 1% each year. That’s backed up by the solar panel manufacturer’s warranty, which guarantees 90% production in the first ten years and 80% by year 25 or 30.
However, a study conducted by The National Renewable Energy Laboratory (NREL) shows a more accurate picture of solar panel degradation. This study took a look at the degradation rates for almost 2,000 solar systems across the world in a variety of climates and found that monocrystalline panels made after the year 2000 degraded at a rate of just 0.4% - less than half of the 1% rate used in the warranties.
| AMBIENT_TEMPERATURE | MODULE_TEMPERATURE | IRRADIATION | SOURCE_KEY | DC_POWER | AC_POWER | DAILY_YIELD | TOTAL_YIELD | DATE | TIME | |
|---|---|---|---|---|---|---|---|---|---|---|
| DATE_TIME | ||||||||||
| 2020-06-15 19:15:00 | 22.767838 | 21.174567 | 0.000000 | A17 | 0.000000 | 0.000000 | 6795.000000 | 7403217.000 | 2020-06-15 | 19:15:00 |
| 2020-06-10 10:45:00 | 27.744023 | 40.183040 | 0.428555 | A10 | 574.525000 | 563.000000 | 2076.500000 | 7223054.500 | 2020-06-10 | 10:45:00 |
| 2020-06-06 20:30:00 | 22.334638 | 20.134107 | 0.000000 | A13 | 0.000000 | 0.000000 | 6603.000000 | 6445031.000 | 2020-06-06 | 20:30:00 |
| 2020-06-15 11:45:00 | 28.399791 | 44.479077 | 0.664058 | A20 | 1016.162500 | 992.600000 | 3656.750000 | 7271493.750 | 2020-06-15 | 11:45:00 |
| 2020-06-16 13:30:00 | 28.401005 | 45.513633 | 0.582289 | A18 | 785.657143 | 768.914286 | 4268.714286 | 7348972.714 | 2020-06-16 | 13:30:00 |
| 2020-06-05 14:15:00 | 28.863662 | 49.925148 | 0.466440 | A5 | 634.237500 | 620.737500 | 5510.250000 | 7322271.250 | 2020-06-05 | 14:15:00 |

[-651.84874473] [[32.09137436]] 0.9792424457596431
([25, 36.8367094809952, 66.47254227682016, 2002], [30, 233.02042896497443, 126.46737575015703, 726], [35, 456.27666666666664, 140.85660950775022, 1650], [40, 557.78077006327, 261.10385466656584, 528], [45, 513.2444733044733, 406.46088696127447, 396], [50, 619.7700929462694, 497.0888537531352, 374], [52, 597.888001998002, 530.8692564083956, 286], [54, 657.343313966735, 560.5904438962372, 418], [56, 676.3748773448775, 545.3942710787205, 198], [58, 704.3017532467533, 591.701524268531, 154], [60, 780.6633279220779, 623.6629982528311, 88], [62, nan, nan, 0], [63, 0.0, 0.0, 22])

The graph below shows the panel temperature as a function of irradiance and air temperature.

| AMBIENT_TEMPERATURE | MODULE_TEMPERATURE | IRRADIATION | SOURCE_KEY | DC_POWER | AC_POWER | DAILY_YIELD | TOTAL_YIELD | DATE | TIME | |
|---|---|---|---|---|---|---|---|---|---|---|
| DATE_TIME | ||||||||||
| 2020-06-16 12:15:00 | 27.39 | 37.04 | 0.4295 | A12 | 631.385714 | 618.585714 | 3417.857143 | 7333108.857 | 2020-06-16 | 12:15:00 |
| 2020-06-05 12:30:00 | 24.78 | 27.29 | 0.2201 | A3 | 371.342857 | 365.000000 | 3937.857143 | 7148640.857 | 2020-06-05 | 12:30:00 |
| 2020-06-03 06:00:00 | 21.87 | 20.34 | 0.0066 | A15 | 5.550000 | 5.362500 | 0.125000 | 7317813.125 | 2020-06-03 | 06:00:00 |
| 2020-06-05 16:00:00 | 29.36 | 44.38 | 0.5305 | A18 | 764.728571 | 748.671429 | 6790.428571 | 7272139.429 | 2020-06-05 | 16:00:00 |
| 2020-06-14 18:45:00 | 24.89 | 24.07 | 0.0005 | A14 | 0.000000 | 0.000000 | 3958.000000 | 6521600.000 | 2020-06-14 | 18:45:00 |
| 2020-06-01 16:15:00 | 26.68 | 29.28 | 0.1280 | A11 | 196.337500 | 192.462500 | 5701.250000 | 6655226.250 | 2020-06-01 | 16:15:00 |
| 2020-06-10 06:00:00 | 21.77 | 19.33 | 0.0091 | A14 | 8.571429 | 8.271429 | 0.000000 | 6493347.000 | 2020-06-10 | 06:00:00 |
| 2020-06-03 16:15:00 | 27.12 | 35.69 | 0.2754 | A19 | 407.737500 | 399.925000 | 7303.000000 | 7162750.000 | 2020-06-03 | 16:15:00 |
| 2020-06-07 16:15:00 | 30.36 | 42.96 | 0.4549 | A11 | 596.275000 | 584.312500 | 7653.750000 | 6700707.750 | 2020-06-07 | 16:15:00 |


This equation provides a rough estimate, relating the solar cell temperature to the air temperature, solar irradiance and a factor called NOCT. NOCT stands for Normal Operating Cell Temperature. Like the temperature coefficient of power, NOCT is measured by the manufacturer and accounts for the heating of the panel from sunlight. A typical NOCT value for solar panels is 45 or 46 °C in a small range of +/- 2/3°.


0.3
A1 seems to be defective (darker during midday), so I'd better take a look others: A10 and A12. They appear to work, or stop working, in turns.
| DATE_TIME | PLANT_ID | SOURCE_KEY | DC_POWER | AC_POWER | DAILY_YIELD | TOTAL_YIELD | |
|---|---|---|---|---|---|---|---|
| 2337 | 2020-06-09 11:15:00 | 4135001 | 1BY6WEcLGh8j5v7 | 12356.750000 | 1205.175000 | 2938.000000 | 6434552.000 |
| 655 | 2020-05-22 12:00:00 | 4135001 | 1BY6WEcLGh8j5v7 | 12689.142860 | 1237.528571 | 3196.142857 | 6308785.143 |
| 2534 | 2020-06-11 12:30:00 | 4135001 | 1BY6WEcLGh8j5v7 | 7434.857143 | 727.942857 | 2538.714286 | 6447519.714 |
| 1946 | 2020-06-05 09:30:00 | 4135001 | 1BY6WEcLGh8j5v7 | 9351.428571 | 913.828571 | 1202.142857 | 6406582.143 |
| 1394 | 2020-05-30 15:15:00 | 4135001 | 1BY6WEcLGh8j5v7 | 8246.375000 | 807.075000 | 5611.625000 | 6370985.625 |
| 2783 | 2020-06-14 02:45:00 | 4135001 | 1BY6WEcLGh8j5v7 | 0.000000 | 0.000000 | 0.000000 | 6463663.000 |
| 199 | 2020-05-17 04:30:00 | 4135001 | 1BY6WEcLGh8j5v7 | 0.000000 | 0.000000 | 0.000000 | 6271605.000 |
| 2758 | 2020-06-13 20:30:00 | 4135001 | 1BY6WEcLGh8j5v7 | 0.000000 | 0.000000 | 7984.000000 | 6463663.000 |
| 1644 | 2020-06-02 05:45:00 | 4135001 | 1BY6WEcLGh8j5v7 | 0.000000 | 0.000000 | 0.000000 | 6383439.000 |
| 628 | 2020-05-22 05:15:00 | 4135001 | 1BY6WEcLGh8j5v7 | 0.000000 | 0.000000 | 0.000000 | 6305589.000 |
| 347 | 2020-05-18 17:30:00 | 4135001 | 1BY6WEcLGh8j5v7 | 1076.714286 | 104.671429 | 4959.285714 | 6283609.286 |
| 1801 | 2020-06-03 21:15:00 | 4135001 | 1BY6WEcLGh8j5v7 | 0.000000 | 0.000000 | 7341.000000 | 6397809.000 |
I found some electrical action in night time:
24-05-2020 00:00,4135001,1BY6WEcLGh8j5v7,0,0,995.75,6320403 => We'll cut off at 19:30
15 may: group down

avoiding bloobs and bliebs by coding, or just omit night data ...
N.M. Pearsall, in The Performance of Photovoltaic (PV) System, 2017
The three performance parameters discussed in the previous section express the overall performance of the system but it is sometimes useful to consider the specific performance of certain parts of the system in order to ensure the correct design and operational choices.
It is possible to determine the inverter efficiency if measurements of both DC input and AC output are provided. In general, the efficiency of a PV inverter is a function of the input power and input voltage, with a typical set of efficiency curves being shown in Fig. 1.4. At medium to high light levels and therefore input power from the array, the inverter has a high efficiency, generally well in excess of 90%. At low irradiance levels, the efficiency drops off sharply. This means that we can determine an optimum inverter capacity in comparison with the array capacity, such that the balance between energy loss at the low irradiance end due to reducing efficiency is balanced against energy loss at the high irradiance end due to limiting because of the maximum inverter capacity. This is illustrated in Fig. 1.5, assuming that the basic shape of the inverter efficiency curve does not depend on inverter capacity. Clearly, the balance between energy generation at low and high irradiance values is dependent on the climate and, therefore, so is the optimum inverter/array ratio, with the general approach of a reduction in this ratio as the latitude increases.
Fig. 1.4. Typical inverter efficiency curve as a function of DC
input voltage. The rated input voltage will be a value around the middle
of the allowed voltage range. Curves are also shown for higher and
lower voltages, closer to the limits of the voltage range.
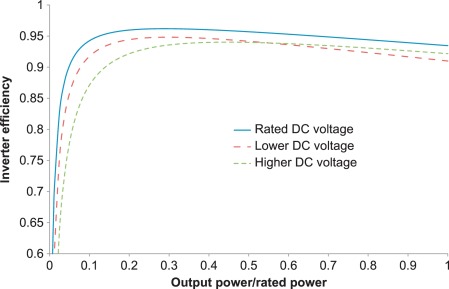
Fig. 1.5. Comparison of inverter efficiency for two inverters, A
and B, where the rated capacity of B is 75% of that of A. The general
shape of the efficiency curve is assumed to be unaffected by the
capacity and the capacity of the PV array is assumed to be equal to A.
It can be seen that inverter B provides more output than A at low
irradiance values but limits at PV array output values higher than 75%
of rated capacity. The optimum capacity of the inverter will depend on
the ratio between the energy received at low irradiance and at high
irradiance for that particular system. 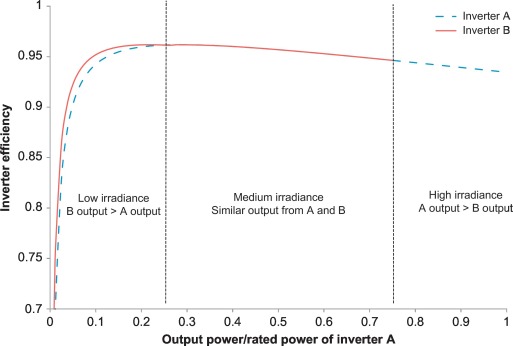
Because of the variation of efficiency with input power, and therefore irradiance on the array, the average operating efficiency of the inverter will vary with climate. In general, the technical information for a PV inverter will include both the peak efficiency (usually between 95% and 98% depending on the inverter technology) and a weighted efficiency to account for the operation at different irradiance levels. In Europe, this weighted efficiency is termed the Euro efficiency and can be represented by Eq. (1.10), as follows: (1.10)
Here, Eff5% is the DC to AC conversion efficiency at an input power of 5% of the inverter capacity, with similar definitions for the other terms. The weighting reflects the amount of energy predicted to be gained at each energy level. An alternative weighting, using the same rationale and approach, is the California Energy Commission or CEC efficiency, calculated as follows [10]: (1.11) $$CEC{efficiency}= 0.04Eff_{10%} +0.05Eff{20%} + 0.12*Eff{30%} +0.21Eff_{50%} +0.53Eff{75%} +0.05*Eff{100%}$$
Here the weighting factors are more heavily biased towards the higher irradiance levels, to reflect the difference between the climates in the southwestern USA and central Europe. The use of either the Euro or CEC efficiency gives a lower but more representative value than the peak efficiency in terms of considering the overall inverter efficiency across a period of operation. Clearly, other weightings could be developed for other climate options, although there needs to be consensus within the community for widespread use.
For a stand-alone PV system, the important parameter is not the total energy generated but whether the load is met for the required time, that is, the service provided by the system. This is sometimes assessed by direct reference to the load, for example, amount of water pumped, amount of product manufactured using PV electricity. However, it is also possible to define parameters to express the system performance, such as the total amount of time for which the load is not met (to be compared with the loss of load probability defined in the system design) and the battery index, which is the percentage of days in a given period when full charge of the batteries in the system is achieved. In general, values over 30% are considered as good, although very high values may indicate an oversized array.
Higher ambient and panel temperatures reduce the capability of solar modules to efficiently produce energy.
One sort of device is the thermophile pyranometer which measures the hemispheric irradiation of the sun.
| DATE_TIME | SOURCE_KEY | AMBIENT_TEMPERATURE | MODULE_TEMPERATURE | IRRADIATION | |
|---|---|---|---|---|---|
| 0 | 2020-05-15 00:00:00 | HmiyD2TTLFNqkNe | 25.18 | 22.86 | 0.0 |
| 1 | 2020-05-15 00:15:00 | HmiyD2TTLFNqkNe | 25.08 | 22.76 | 0.0 |
| 2 | 2020-05-15 00:30:00 | HmiyD2TTLFNqkNe | 24.94 | 22.59 | 0.0 |
| 3 | 2020-05-15 00:45:00 | HmiyD2TTLFNqkNe | 24.85 | 22.36 | 0.0 |
| 4 | 2020-05-15 01:00:00 | HmiyD2TTLFNqkNe | 24.62 | 22.17 | 0.0 |

correction on dc power values of plant 1
solar1GEN["DC_POWER"] = solar1GEN.DC_POWER/10
solar1GENdt["DC_POWER"]= solar1GENdt.DC_POWER/10

Selecting all sensors of A or B group on May 23, or the whole month of May.
Comparison of the standard deviations of some measurements by a rolling window
A normally behaving inverter: B1
A badly behaving inverter: B4
| SOURCE_KEY_x | AMBIENT_TEMPERATURE | MODULE_TEMPERATURE | IRRADIATION | SOURCE_KEY_y | DC_POWER | AC_POWER | DAILY_YIELD | TOTAL_YIELD | DATE | TIME | AC_std | RAD_std | Mod_T_std | Amb_T_std | AC_avg | |
|---|---|---|---|---|---|---|---|---|---|---|---|---|---|---|---|---|
| DATE_TIME | ||||||||||||||||
| 2020-05-23 17:00:00 | HmiyD2TTLFNqkNe | 31.265975 | 37.791107 | 0.246216 | A12 | 337.287500 | 331.450000 | 8225.500000 | 7161938.500 | 2020-05-23 | 17:00:00 | 98.933373 | 0.072347 | 2.938838 | 0.458182 | 4.201012e+02 |
| 2020-05-23 07:00:00 | HmiyD2TTLFNqkNe | 22.405438 | 22.988533 | 0.069788 | A12 | 102.414286 | 99.514286 | 43.571429 | 7153756.571 | 2020-05-23 | 07:00:00 | NaN | NaN | NaN | NaN | NaN |
| 2020-05-23 18:45:00 | HmiyD2TTLFNqkNe | 28.136104 | 26.834678 | 0.000094 | A12 | 0.000000 | 0.000000 | 8471.000000 | 7162184.000 | 2020-05-23 | 18:45:00 | 30.583583 | 0.022464 | 1.552659 | 0.448631 | 1.914226e+01 |
| 2020-05-23 13:15:00 | HmiyD2TTLFNqkNe | 32.266697 | 58.086601 | 0.892800 | A12 | 1190.950000 | 1161.975000 | 5361.875000 | 7159074.875 | 2020-05-23 | 13:15:00 | 149.295972 | 0.112645 | 1.615404 | 0.619464 | 1.015282e+03 |
| 2020-05-23 10:00:00 | HmiyD2TTLFNqkNe | 28.074166 | 48.958026 | 0.673765 | A12 | 866.575000 | 847.537500 | 1874.500000 | 7155587.500 | 2020-05-23 | 10:00:00 | 61.592482 | 0.047080 | 1.903767 | 0.233336 | 8.624601e+02 |
| 2020-05-23 19:00:00 | HmiyD2TTLFNqkNe | 27.826436 | 26.217763 | 0.000000 | A12 | 0.000000 | 0.000000 | 8471.000000 | 7162184.000 | 2020-05-23 | 19:00:00 | 1.739268 | 0.002893 | 0.898602 | 0.321602 | 1.004167e+00 |
| 2020-05-23 16:30:00 | HmiyD2TTLFNqkNe | 32.160376 | 43.643978 | 0.389097 | A12 | 537.500000 | 526.825000 | 8011.000000 | 7161724.000 | 2020-05-23 | 16:30:00 | 74.223911 | 0.051018 | 2.677864 | 0.636004 | 6.053583e+02 |
| 2020-05-23 19:15:00 | HmiyD2TTLFNqkNe | 27.588753 | 25.794478 | 0.000000 | A12 | 0.000000 | 0.000000 | 8471.000000 | 7162184.000 | 2020-05-23 | 19:15:00 | 0.000010 | 0.000055 | 0.523095 | 0.274463 | 3.277378e-13 |


Inverter B1 doesn't slow down the current in its circuit by regulating the voltage. But, it can handle it.

Inverter B4 doesn't slow down the current in its circuit by regulating the voltage. The current drop starts at 10:30.
I noticed that on average the temperature here is 4° higher than at
plant 1. What happens here is that the voltage drops happen sooner (at a
lower V.) with every degree of temperature increase. (See 1st fig. of §
1.6)

It appears that the current stalls and slows down when panel temperature reaches 63°C. Current resumes an upward trend only after the panel temperature falls below 58°C.
First I tried an attempt to link age to percent change in ac, irradiation, module and ambient temperature.
Perhaps it works better with the original values.
Mean Absolute Error: 2.871171844641102 Mean Squared Error: 9.595147847732864 Root Mean Squared Error: 3.0976035652957377 Mean Absolute Percentage Error (MAPE): 6.21 Accuracy: 93.79
Mean Absolute Error: 0.02999389097021875 Mean Squared Error: 0.02019906912445018 Root Mean Squared Error: 0.14212342918903337 Mean Absolute Percentage Error (MAPE): 0.06 Accuracy: 99.94
The temperature coefficient of Pmax, or just Pmax for short, is how much a solar panel’s efficiency is reduced by for each degree increase in the panel’s temperature. Pmax is expressed as a negative percentage and a typical value is -0.4%. This is how much a solar panel’s efficiency decreases for each degree its temperature is above 25 degrees.
NOCT stands for Nominal Operating Cell Temperature. It can also be called NMOT or Nominal Module Operating Temperature.
NOCT is the temperature a panel’s solar cells will be at under the following specific conditions:
A typical NOCT value for a panel is 45 degrees Celsius. The lower it is the better because it means the panel will be cooler when sitting in the sun. Typically this value will have a margin of error such as 45 +/- 3 degrees. This means there is a 68% chance the NOCT of the solar panel will be between 42 and 48 degrees. This is a considerable amount of variation, but if you have 20+ modules there is a good chance it will even out to around 45 degrees on average.
Most solar panel datasheets will tell you what their NOCT is, but some such as SunPower’s, keep it a secret.
I've picked HiA-S300RG as an example, because it is cheap +- 226 AU$ and is produced close to India. We are reluctant to trust Chinese datasheets.
Nominal Output (Pmpp) W 300
Module Efficiency % 18.44
Nominal Operating Cell Temperature 45°C ± 2
Operating Temperature -40 – 85°C
Temperature Coefficient of Pmax -0.41%/°C
Most manufacturers claim 45°C ± 3, but Hyundai seems honest with 45°C ± 2 ° sd. A smaller temp. range translates to: clients can be more sure this product will perform better as their peers, as long as it stays <= 47°C.