Honey Bee Colonies
The
main objective of this effort is to get an better idea of the amount of
honey bee colonies losses over the states during the timespan of 1
year.
The second objective is finding out how much impact different stressors have on honey bee colonies.
The third aim is searching for any relations between stressors and losses.
January-March 2018
The source of this data is the Report on "Honey Bee Colonies"; ISSN: 2470-993X
Released August 1, 2019, by the National Agricultural Statistics Service (NASS), Agricultural Statistics Board, United States Department of Agriculture (USDA). Information about all NASS surveys and reports is available online at www.nass.usda.gov.
1/ January 1 colonies plus all colonies moved into that state during the quarter.
2/ Percent lost is the number of lost colonies divided by maximum
colonies except for the United States, where percent lost is the number
of lost colonies divided by the January 1 colonies.
3/ Defined as any surviving colony that was requeened or received new honey bees through nuc or package.
4/ Percent renovated is the number of renovated colonies divided by
maximum colonies except for the United States, where percent renovated
is the number of renovated colonies divided by the January 1 colonies.
Honey bee colonies: the TOP 15 states
at 1st January 2018.
Note the big increase in colonies during the Q1 in California: from 1.150.000 to 1.540.000. In February the almond trees in California have their blossom season, however the local bee population is too small for a full pollination. So they have to attract many non-local bee colonies. Bee colonies are transported from state as far as Michigan. These transports induce stress to the bees: temperature differences, fuels and vibrations. In 2019 a study found that esp. temperature differences are a factor in CCD, colony collapse disease.
Let's see if we can visualize these movements.

California has an armada of bee colonies, and this is also the case for some other southeners like Texas, FL and GA.
In the North is Idaho the top colony keeper, followed by Oregon and ND.
Colonies: numbers of lost, renovated and added

Most renovations are done in southern states, apparently.
Colonies: percent lost, percent renovated, percent added


Average number of colonies lost, renovated, added
Averages of percent colonies lost, renovated, added
I'll assign the "other states" value to Nevada and Alaska, but only for the creation of geoplots.
April-June 2018
Interstate transportation of hives
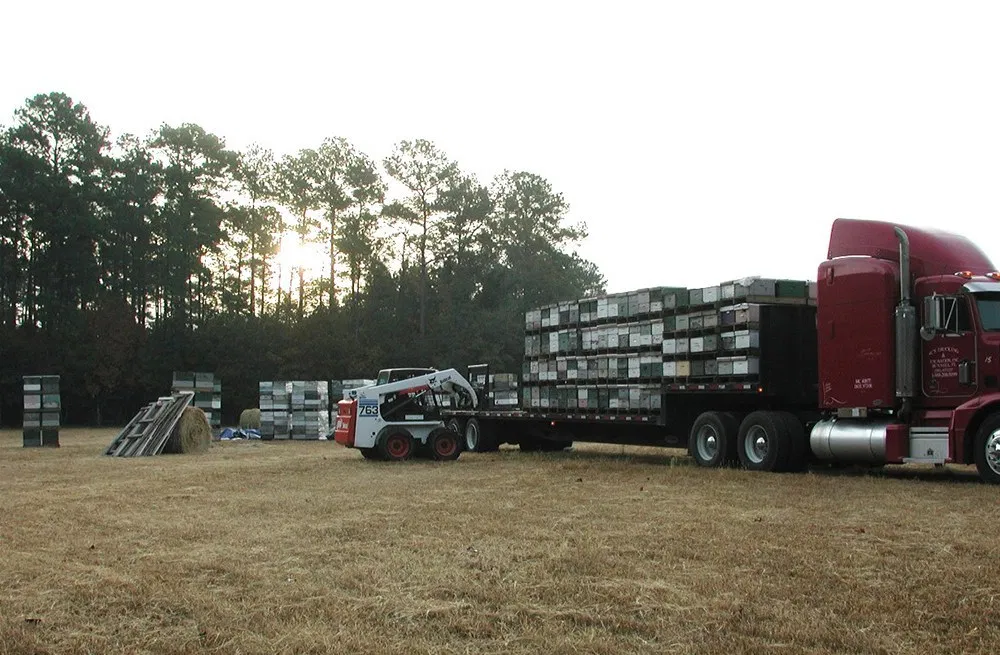
Transporting Honey Bee Hives
source: Managed Honey Bee Welfare Problems and Potential Interventions


After the almonds pollination job is done in February, a portion of the hives will return home, while some will go to another pollination job elsewhere.
July-September 2018
October-December 2018
Propagate pcts and amounts from start "loss" through to "col_loss".
The reporters use a strange way of reporting the data: they base e.g.
the % of lost colonies on the maximum colonies in that state during
that quarter. So the % are not based on the colonies at 1st day of the
quarter.
After you take note of the number of colony losses, you might understand why this approach has been chosen.
- "Maximum colonies" are the number of "January 1 colonies" plus all colonies moved into that state during the quarter.
- "Percent lost" is the number of lost colonies divided by maximum colonies except for the United States, where
percent lost is the number of lost colonies divided by the January 1 colonies. - "Renovated colonies" is defined as any surviving colony that was requeened or received new honey bees through nuc or package.
- "Percent renovated" is the number of renovated colonies divided by maximum colonies
This way it is impossible to know how many colonies were there introduced permanently de facto, or how many colonies were there interim, for e.g. pollination purposes, and would leave after their job was done.
movements of hives over 4 quarters

Movements of colonies during 2018.
The maximum numbers of colonies present in a state during a quarter, minus the numbers of colonies on day 1 of the quarter.
This gives us the intraquaterly number of colony movements. Perhaps colony activity is a better word in this case.
movements of colonies within a quarter.


Numbers of colonies vs. number of losses, per region

Additions of colonies pct vs. pct of losses, per region
Blue for Jan. - March, Orange for April - June , Green for July - Sep. , Red for Oct - Dec.

Lost colonies: average percent over 4 quarters of 2018.
A look at the plot makes me guess a quarterly average of almost 10% of the colonies that were lost.

Percentage lost colonies by state, over 4 qtr.

Percent renovated colonies over 4 qtr.

Percent added colonies over 4 qtr.

Colony Health Stressors
Percent
of colonies affected by stressors anytime during the quarter, for
Operations with Five or More Colonies - States and United States.
A colony may be affected by multiple stressors during the quarter.
- Other pests and parasites:
Tracheal mites, nosema, hive beetle, wax moths, etc. - Diseases:
Includes American and European foulbrood, chalkbrood, stonebrood, paralysis (acute and chronic), kashmir, deformed wing, sacbrood, IAPV, Lake Sinai II, etc. - Other:
Includes weather, starvation, insufficient forage, queen failure, hive damage/destroyed, etc. - Notation (z): was arbitrarily converted to 0.24.
Stressors January-March 2018
Random Forest Regressor

The group of Other and Unknown surprisingly has the most importance value, in case of the 45 states combined. What will be found if we only select the 15 biggest colony keepers?

The most important parameter amongst the top 15: "Other pests and parasites"!?
Varroa mites % 2018 USA
Percentage of colonies affected by Varroa mites anytime during the first quarter Q1 of 2018.
Stressors April-June 2018
Stressors July-September 2018
Stressors October-December 2018
Stressors full year 2018
Distribution curves

Honey bee yields per state and their stressors
we have data of year 2018 for stressors, but yields and production dataset only goes till 2017.
Colonies Lost, Added, Renovated Jan - Mar 2019
plan to use this set as validation set random forest regressor.

Random Forest Regressor Q4 2108
What is the influence of stressors in Q4 2108 on the Q1 2019 losses?
- exclude California which has way too many colonies, and colony movements.

With this result it shows that the number of colonies at day 1 of
the quarter and the max. amount of colonies during that quarter are the
parameters that are important for the losses next quarter.
This unexpected result prompted me to search additional info, and could
find some explanations that are linked to growing relation bt.
apiculture and horticulture.
- For pollination of the flowers, most crops need honey bees. Moreover, some crops cannot be pollinated by feral honey bees or other pollinating insects: e.g. almonds.
- Nearly all U.S. almond acreage is concentrated in California’s Central Valley region.
- The almond bloom period is in late February, which does not
interferes with other crops, so California attracts colonies from other
states.
- Estimates for the percentage of non-local colonies ranges from 50-66%.
I knew that commercial bee colony contracting for almond orchard pollination happened, but didn't had numbers.
- As late as 1988, however, pollination services accounted for only 11 percent of beekeeper revenue. In 2016, that share had risen to 41 percent, slightly surpassing revenue from honey sales.
- In 2016, almonds accounted for 82 percent of all U.S. expenditures on pollination services. High fees explain only part of this large share. Regardless of price, almonds account for 61 percent of all colony rentals and 52 percent of all acres on which colonies are placed. Almond acreage growth has coincided with greater planting density, which may also have raised the crop’s pollination needs. In 1990, U.S. farmers harvested 411,000 acres of almonds at 88 trees per acre. In 2016, they harvested 940,000 acres at 116 trees per acre.
Sources:
- Economic Effects and Responses to Changes in Honey Bee Health, ERR-246 - USDA, Economic Research Service March 2018.
- Driven by Almonds, Pollination Services Now Exceed Honey as a Source of Beekeeper Revenue July 2018
The correlation bt. honey yield and number of colonies is poor, for several reasons.
- The average amount of honey a bee produces depends on the size of the colony. Hives with more bees are more efficient at producing honey.
- honey yields depend on the kind of crops the bees can harvest.
merge stressors and colonies (max) of the same quarter
stressors and colonies (max) are from the same quarter, but the target is comprised of losses of the next quarter.