Autosaving every 400 seconds
'%.5f'
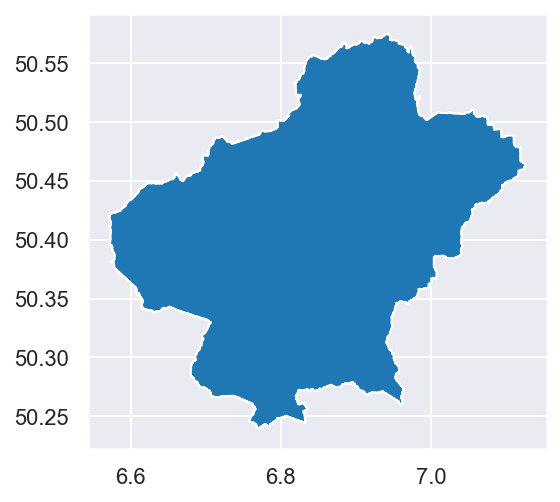
1 Tributaries of the Ahr: drainage area's and outflows
Let's
have a look at the properties of the drainage area's and their
outflows, by using GIS software and latitude and longitude coordinates.
There had a lot of preparation work to be done before the data of
interest could be merged. A big part is setting up the geographical
framework for the AOI area of interest, which was handled with python
modules and QGIS.
Author: Van Oproy Kurt
1.0.1 Distance to the measurestation of Altenahr
- 'Latitude' & 'Longitude': source area coords
- 'Lati' & 'Long': outlet point coords
- "Streamcode" is not following all official Streamcode numbers
| Bach | Distance | Lati | Long | Latitude | Longitude | Streamcode | |
|---|---|---|---|---|---|---|---|
| Stream | |||||||
| Sahr | Sahrbach | 2.17 | 50.51 | 6.97 | 50.54 | 6.85 | 27188 |
| Liers | Liersbach | 10.00 | 50.46 | 6.94 | 50.53 | 6.83 | 271872 |
| Armuths | Armuthsbach | 18.80 | 50.45 | 6.87 | 50.47 | 6.71 | 271856 |
| Ans | Ansbach | 22.00 | 50.43 | 6.85 | 50.44 | 6.75 | 271854 |
| Nohner | Nohnerbach | 35.50 | 50.36 | 6.83 | 50.28 | 6.88 | 271812 |
| Trier | Trierbach | 34.00 | 50.36 | 6.83 | 50.30 | 6.91 | 27184 |
| Wirft | Wirftbach | 22.00 | 50.37 | 6.84 | 50.34 | 6.93 | 271899 |
| Adenauer | Adenauerbach | 11.20 | 50.44 | 6.93 | 50.35 | 6.97 | 27186 |
| Denn | Dennbach | 6.30 | 50.48 | 6.99 | 50.42 | 6.97 | 2718748 |
| Staffel | Staffelbach | 10.20 | 50.48 | 7.03 | 50.46 | 7.11 | 271874 |
| Vischel | Vischelbach | 1.00 | 50.51 | 6.98 | 50.57 | 6.94 | 271892 |
| Weiden | Weidenbach | 8.30 | 50.48 | 7.02 | 50.39 | 7.03 | 2718741 |
array([6.85, 6.83, 6.71, 6.75, 6.88, 6.91, 6.93, 6.97, 6.97, 7.11, 6.94,
       6.65])
numpy.ndarray
((12, 2), (12, 2), (12,), (12,), (12, 2))
[[-1.   -1.  ]
 [-0.82 -0.82]
 [-0.64 -0.64]
 ...
 [ 0.64  0.64]
 [ 0.82  0.82]
 [ 1.    1.  ]] [50.54 50.53 50.47 50.44 50.28 50.3  50.34 50.35 50.42 50.46 50.57 50.44]
Correcting some issues with some shapefiles.
c:\program files\python38\lib\site-packages\geopandas\_compat.py:111: UserWarning: The Shapely GEOS version (3.8.1-CAPI-1.13.3) is incompatible with the GEOS version PyGEOS was compiled with (3.10.0-CAPI-1.16.0). Conversions between both will be slow.
  warnings.warn(
| geometry | |
|---|---|
| 0 | POLYGON ((6.57550 50.42198, 6.57271 50.39538, ... |
| 1 | POLYGON ((6.92448 50.27242, 6.84534 50.27173, ... |
| 2 | POLYGON ((6.59683 50.43010, 6.61911 50.44731, ... |
c:\program files\python38\lib\site-packages\geopandas\_compat.py:111: UserWarning: The Shapely GEOS version (3.8.1-CAPI-1.13.3) is incompatible with the GEOS version PyGEOS was compiled with (3.10.0-CAPI-1.16.0). Conversions between both will be slow.
  warnings.warn(
| geometry | |
|---|---|
| 0 | POLYGON ((6.69293 50.45849, 6.67960 50.45335, ... |
| Metric | Value | geometry | |
|---|---|---|---|
| 0 | Landscape Proportion | 0.61 | None |
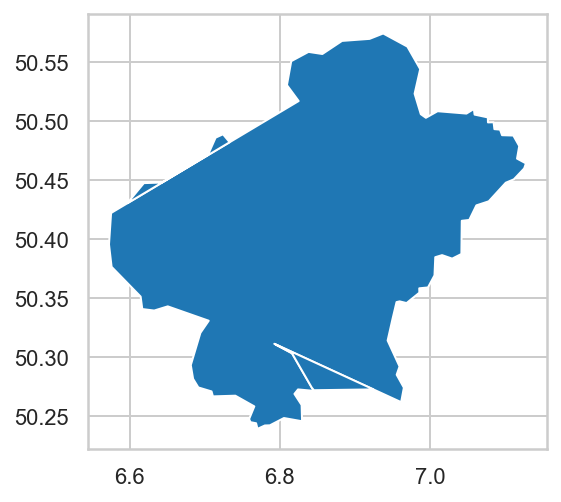
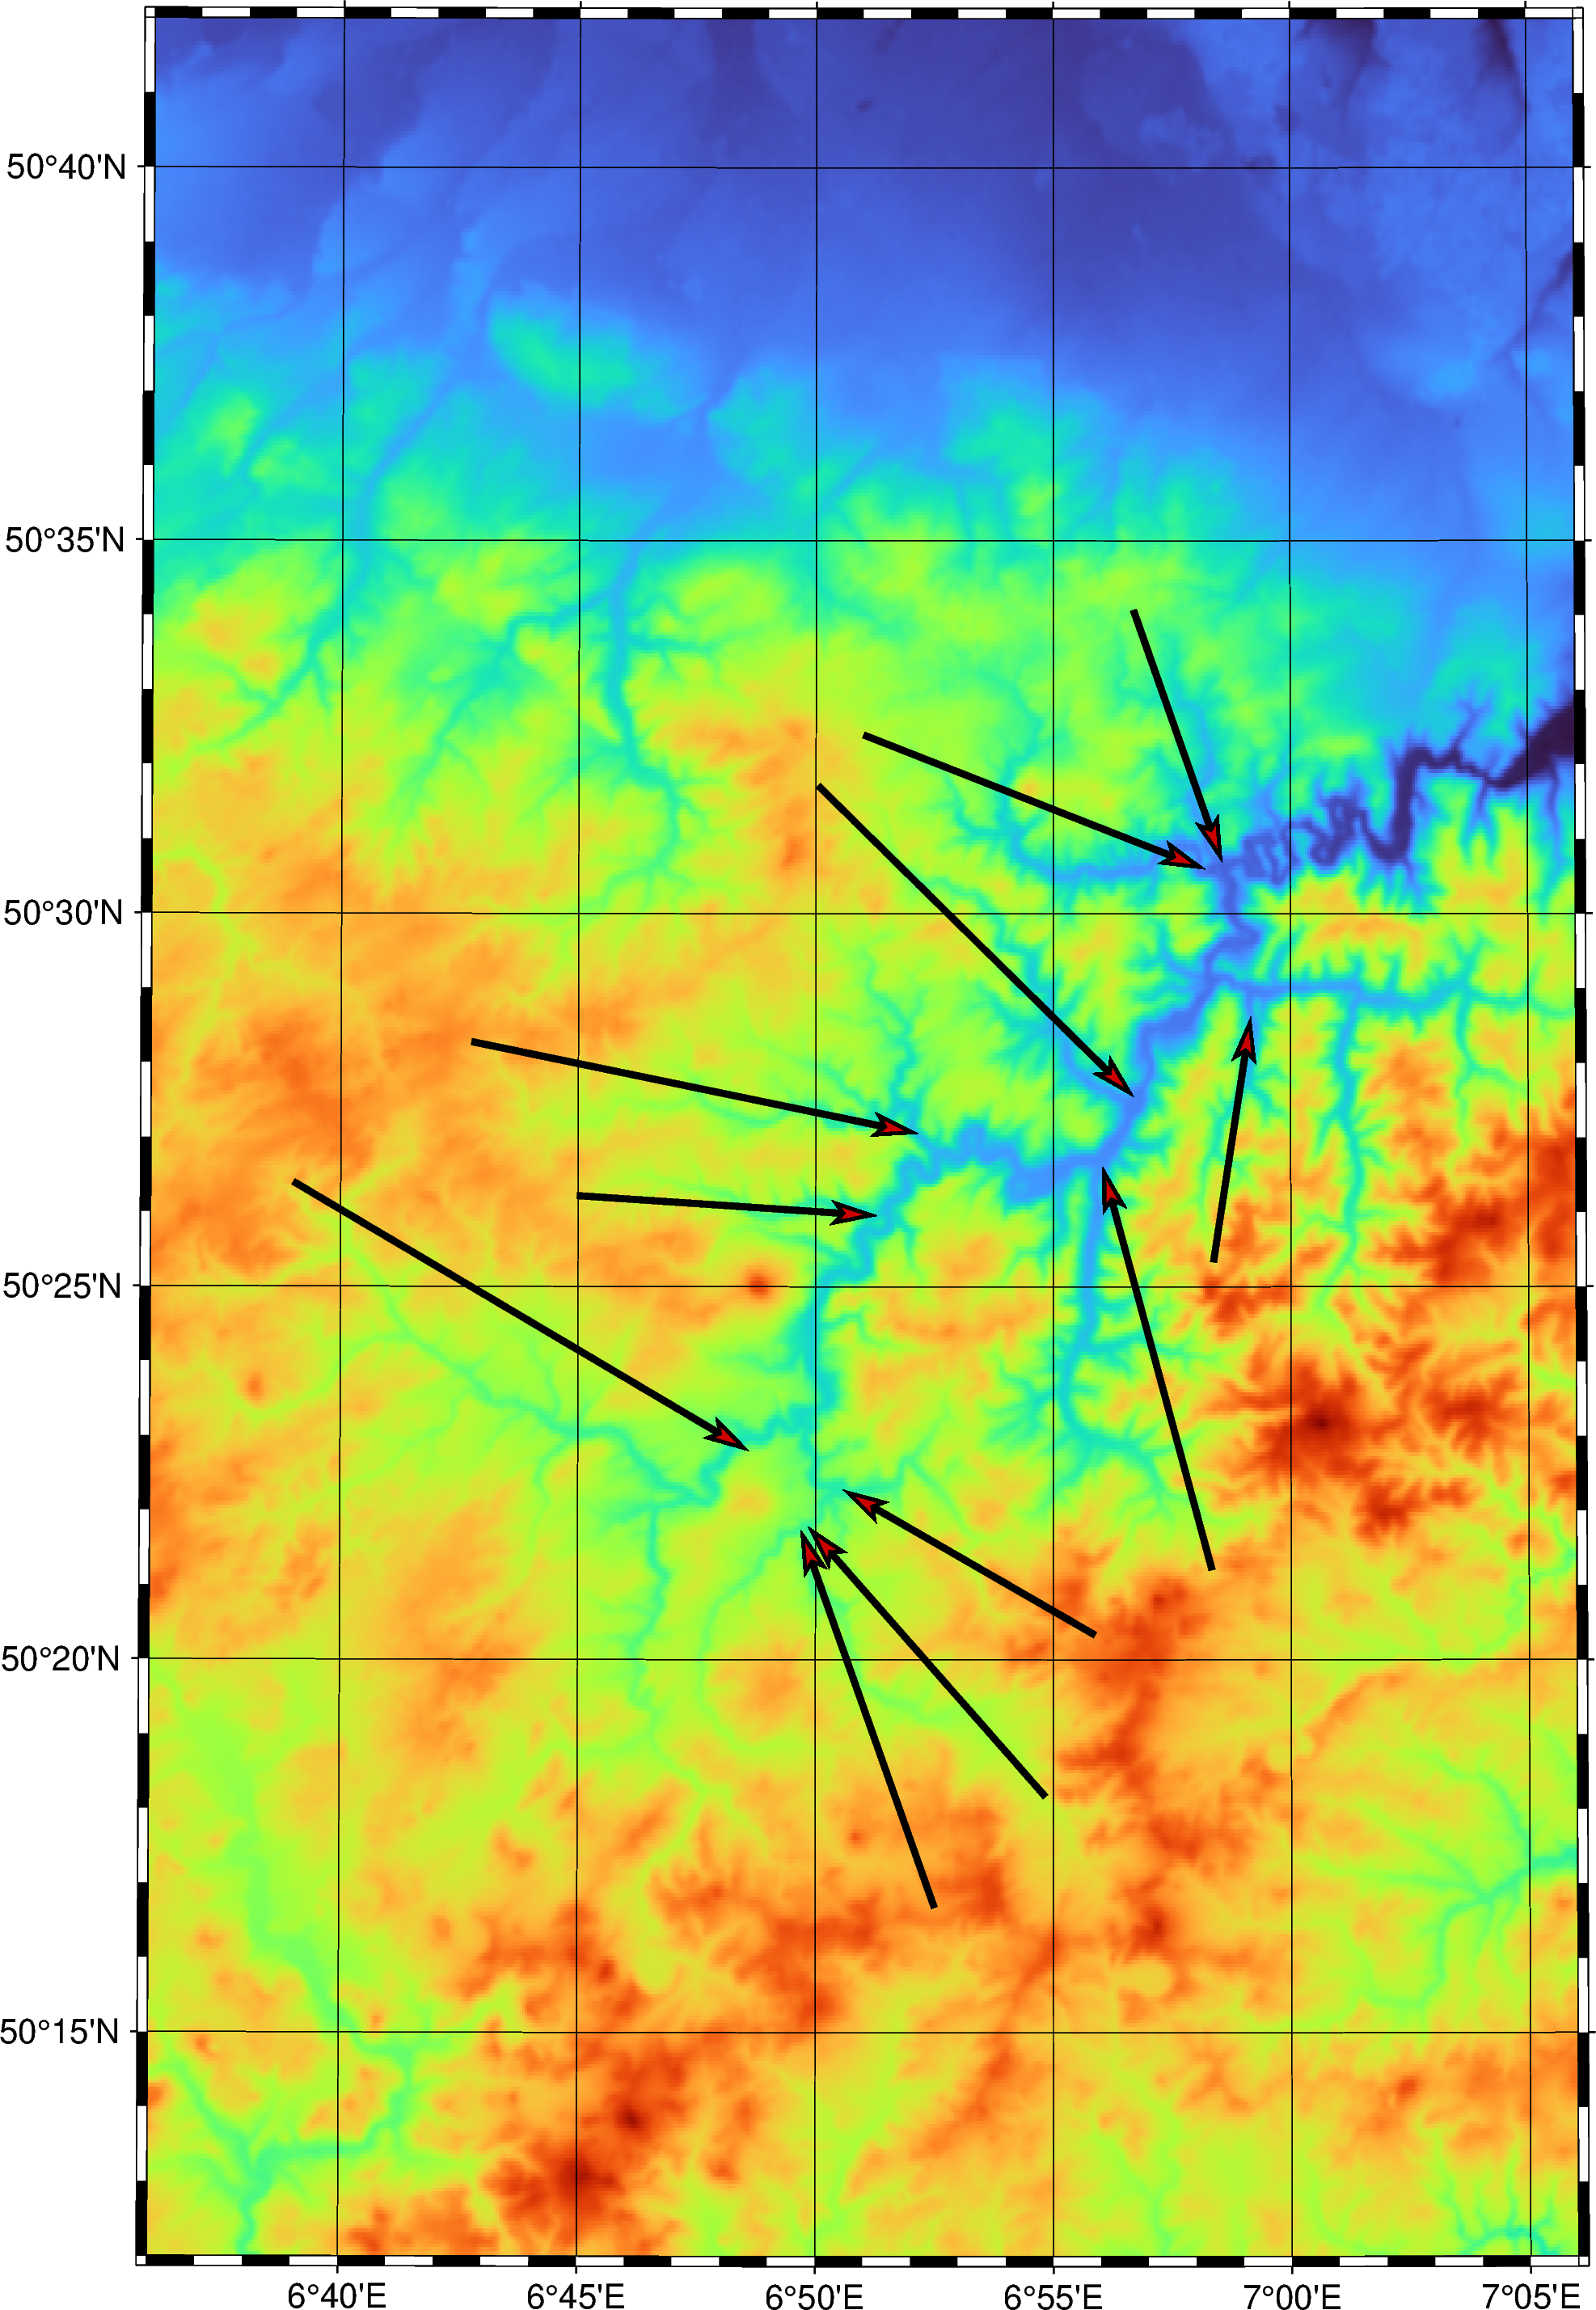
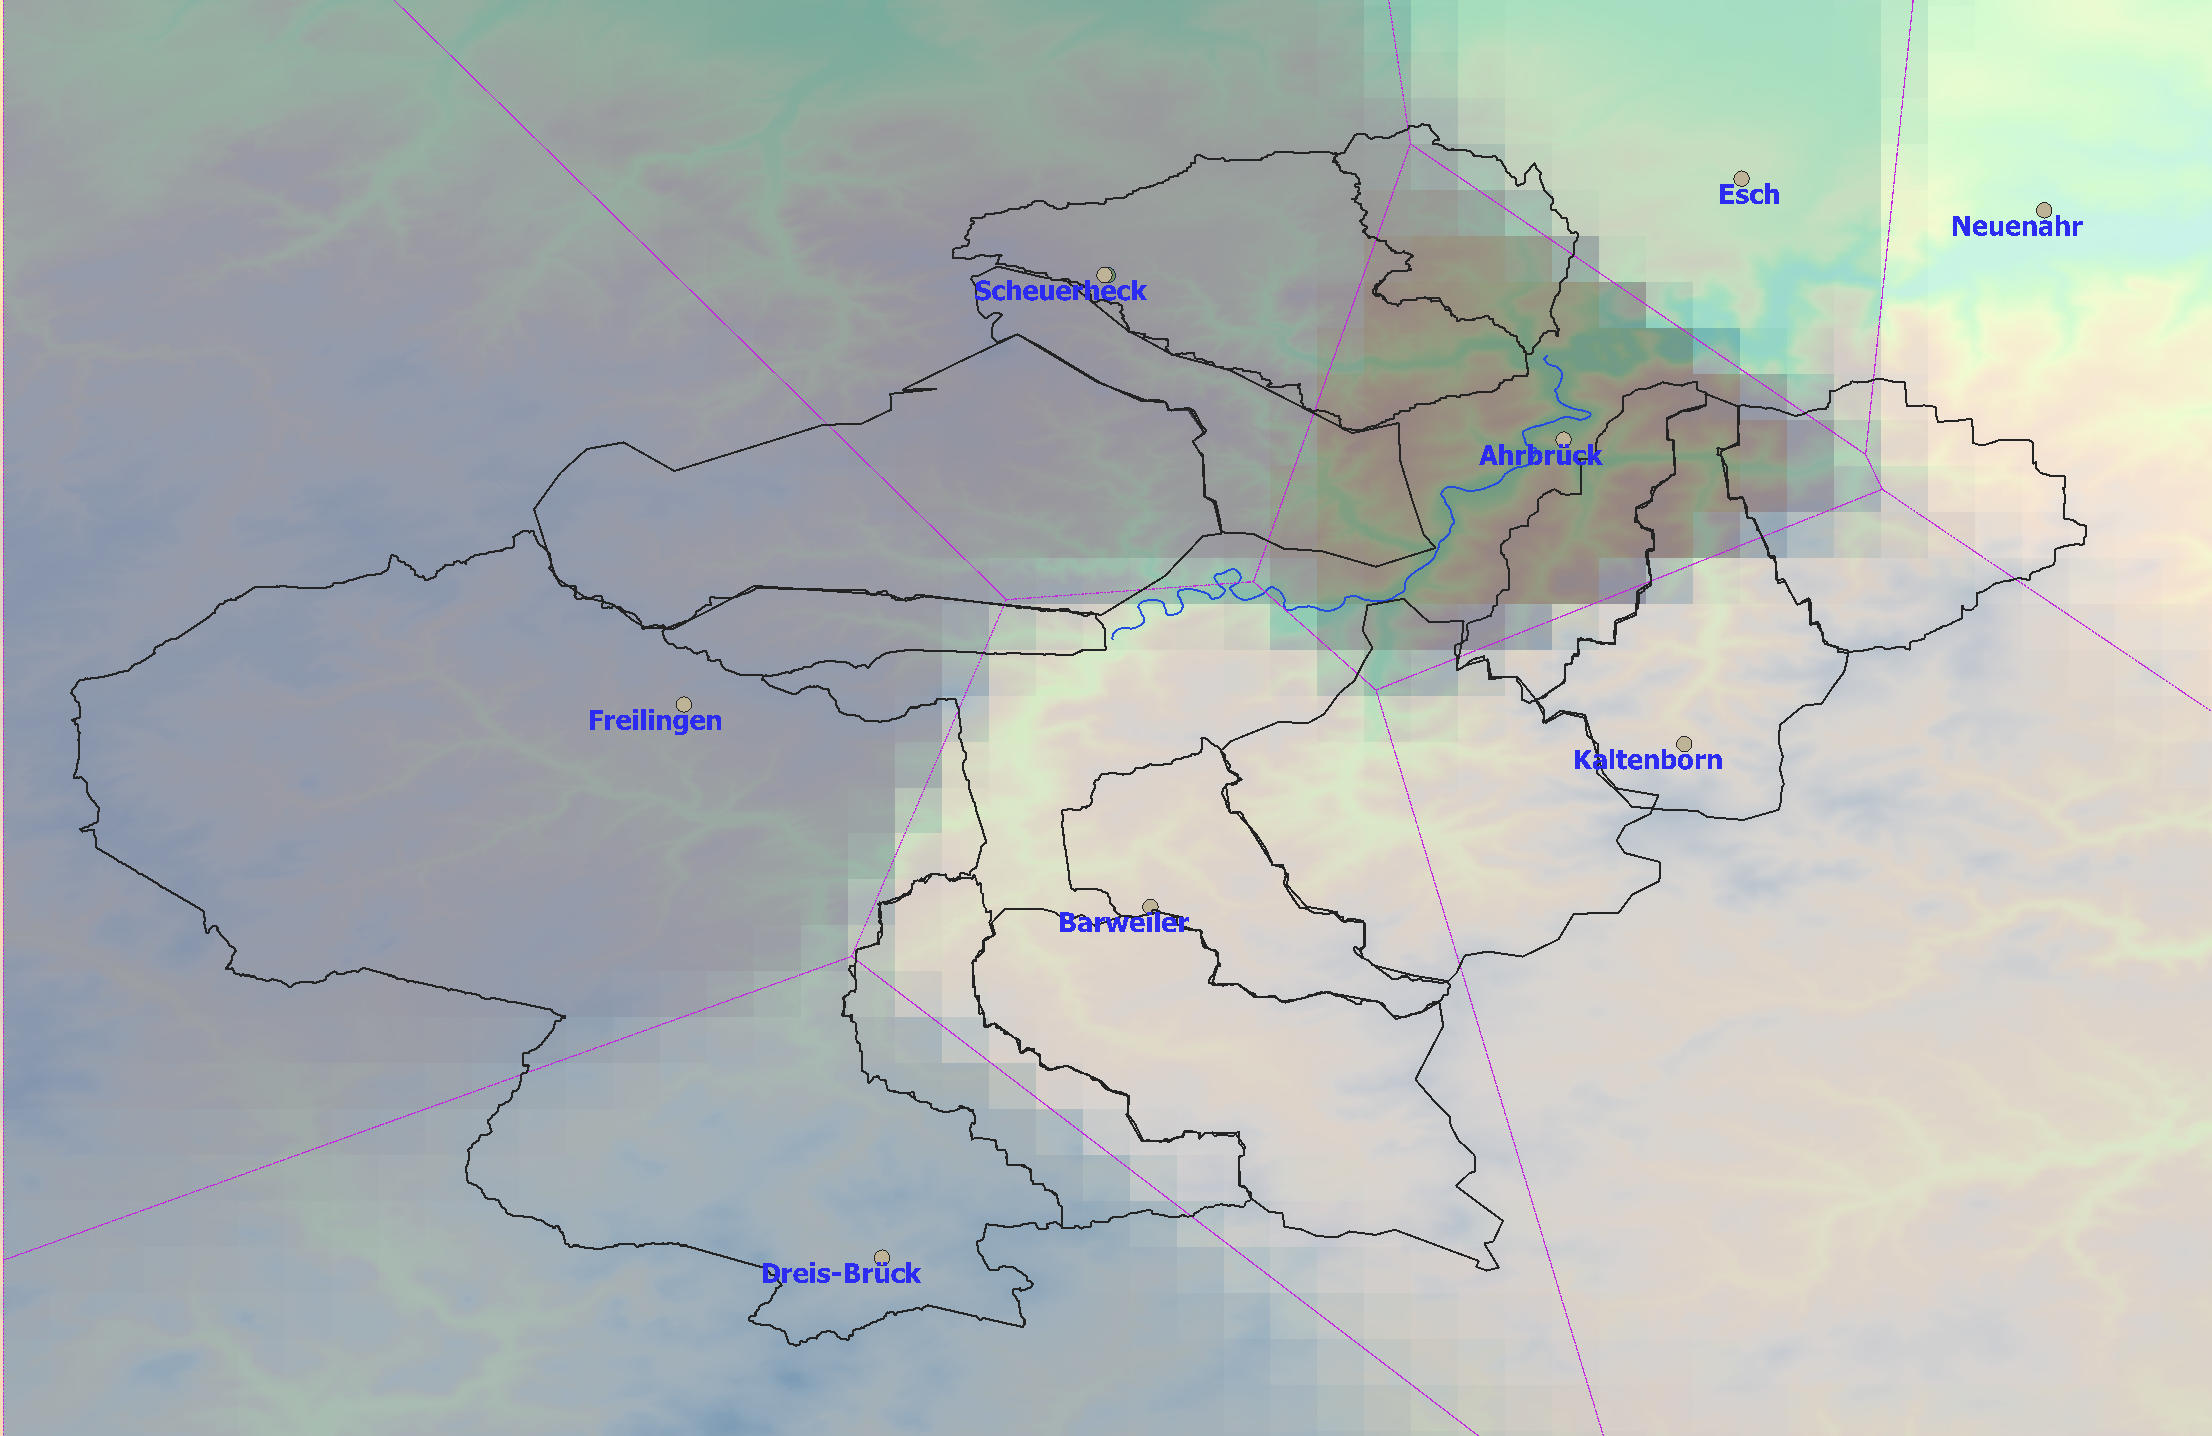
1.0.2 Outflow points of the side streams
This map shows the direction from source to outlet points of the main tributaries.
array([[ 6.65, 50.44,  6.81, 50.38],
       [ 6.85, 50.54,  6.97, 50.51],
       [ 6.83, 50.53,  6.94, 50.46],
       [ 7.11, 50.46,  7.06, 50.48]])
('EPSG', '26915')
'3.1.0'
cc = CRS('esri:7019') cc CRSError: Invalid projection: esri:7019: (Internal Proj Error: proj_create: crs not found)
| Name | Area | East | North | geometry | |
|---|---|---|---|---|---|
| 0 | Watershed-Vischel | 32374176 | None | None | POLYGON ((6.95083 50.52250, 6.95056 50.52250, ... |
<Geographic 2D CRS: EPSG:4258>
Name: ETRS89
Axis Info [ellipsoidal]:
- Lat[north]: Geodetic latitude (degree)
- Lon[east]: Geodetic longitude (degree)
Area of Use:
- name: Europe - onshore and offshore: Albania; Andorra; Austria; Belgium; Bosnia and Herzegovina; Bulgaria; Croatia; Cyprus; Czechia; Denmark; Estonia; Faroe Islands; Finland; France; Germany; Gibraltar; Greece; Hungary; Ireland; Italy; Kosovo; Latvia; Liechtenstein; Lithuania; Luxembourg; Malta; Moldova; Monaco; Montenegro; Netherlands; North Macedonia; Norway including Svalbard and Jan Mayen; Poland; Portugal; Romania; San Marino; Serbia; Slovakia; Slovenia; Spain; Sweden; Switzerland; United Kingdom (UK) including Channel Islands and Isle of Man; Vatican City State.
- bounds: (-16.1, 32.88, 40.18, 84.17)
Datum: European Terrestrial Reference System 1989
- Ellipsoid: GRS 1980
- Prime Meridian: Greenwich
| Name | Area | id | geometry | |
|---|---|---|---|---|
| 0 | Watershed-Nohner | 4.89e+07 | 1.46e+10 | MULTIPOLYGON (((6.82428 50.35194, 6.82428 50.3... |
| 1 | Watershed-Nohner | 4.89e+07 | NaN | POLYGON ((6.79358 50.36074, 6.79351 50.36074, ... |
| 2 | None | NaN | 1.46e+10 | POLYGON ((6.82404 50.35554, 6.82760 50.35932, ... |
c:\program files\python38\lib\site-packages\geopandas\_compat.py:111: UserWarning: The Shapely GEOS version (3.8.1-CAPI-1.13.3) is incompatible with the GEOS version PyGEOS was compiled with (3.10.0-CAPI-1.16.0). Conversions between both will be slow.
  warnings.warn(
| Name | Area | id | fid | area_ | geometry | |
|---|---|---|---|---|---|---|
| 0 | Watershed-Nohner | 48889366.0 | 1.455515e+10 | NaN | NaN | MULTIPOLYGON (((6.82428 50.35194, 6.82428 50.3... |
| 1 | Watershed-Nohner | 48889366.0 | NaN | NaN | NaN | POLYGON ((6.79358 50.36074, 6.79351 50.36074, ... |
| 2 | None | NaN | 1.455515e+10 | NaN | NaN | POLYGON ((6.82404 50.35554, 6.82760 50.35932, ... |
| 3 | None | NaN | NaN | 1.0 | 6.537983e+07 | POLYGON ((6.92729 50.44280, 6.93719 50.44457, ... |
| Name | Area | id | fid | area_ | Name_2 | Area_2 | East | North | Name_3 | Area_3 | East_2 | North_2 | id_2 | Area_4 | Name_4 | Area_5 | East_3 | North_3 | index | fid_2 | Name_5 | Area_6 | East_4 | North_4 | debit | id_3 | id_4 | Name_6 | Area_7 | East_5 | North_5 | geometry | |
|---|---|---|---|---|---|---|---|---|---|---|---|---|---|---|---|---|---|---|---|---|---|---|---|---|---|---|---|---|---|---|---|---|---|
| 0 | None | NaN | NaN | NaN | NaN | None | NaN | None | None | None | NaN | None | None | None | NaN | None | NaN | None | None | None | NaN | None | NaN | None | None | None | None | 1.0 | Watershed-Vischel | 3.24e+07 | None | None | MULTIPOLYGON (((6.91833 50.56539, 6.91874 50.5... |
| 1 | None | NaN | NaN | NaN | NaN | None | NaN | None | None | None | NaN | None | None | None | NaN | None | NaN | None | None | None | NaN | None | NaN | None | None | None | None | 1.0 | None | NaN | None | None | POLYGON ((6.82178 50.53457, 6.84860 50.53019, ... |
| 2 | None | NaN | NaN | NaN | NaN | None | NaN | None | None | None | NaN | None | None | None | NaN | None | NaN | None | None | None | 1.0 | None | NaN | None | None | None | None | NaN | None | NaN | None | None | MULTIPOLYGON (((6.83112 50.51722, 6.83117 50.5... |
| 3 | None | NaN | NaN | NaN | NaN | None | NaN | None | None | None | NaN | None | None | None | NaN | None | NaN | None | None | None | 1.0 | Watershed-Ansbach | 2.62e+07 | None | None | None | None | NaN | None | NaN | None | None | MULTIPOLYGON (((6.85222 50.44038, 6.85194 50.4... |
| 4 | None | NaN | NaN | NaN | NaN | None | NaN | None | None | None | NaN | None | None | None | NaN | None | NaN | None | None | UpperAhr_delin | 1.0 | None | NaN | None | None | None | None | NaN | None | NaN | None | None | MULTIPOLYGON (((6.70207 50.45750, 6.70222 50.4... |
| 5 | None | NaN | NaN | NaN | NaN | None | NaN | None | None | None | NaN | None | None | None | 3.79e+07 | Watershed-Kessel_Staf | 5.81e+07 | None | None | None | NaN | None | NaN | None | None | None | None | NaN | None | NaN | None | None | MULTIPOLYGON (((7.02898 50.49743, 7.02932 50.4... |
| 6 | None | NaN | NaN | 1.0 | 6.54e+07 | None | NaN | None | None | None | NaN | None | None | None | 3.79e+07 | None | NaN | None | None | None | NaN | None | NaN | None | None | None | None | NaN | None | NaN | None | None | MULTIPOLYGON (((6.97369 50.41669, 6.97581 50.4... |
| 7 | None | NaN | NaN | NaN | NaN | None | NaN | None | None | Watershed-Denn | 3.04e+07 | None | None | None | 3.79e+07 | None | NaN | None | None | None | NaN | None | NaN | None | None | None | None | NaN | None | NaN | None | None | MULTIPOLYGON (((7.02028 50.50086, 7.02028 50.4... |
| 8 | None | NaN | NaN | 1.0 | 6.54e+07 | None | NaN | None | None | Watershed-Denn | 3.04e+07 | None | None | None | NaN | None | NaN | None | None | None | NaN | None | NaN | None | None | None | None | NaN | None | NaN | None | None | MULTIPOLYGON (((6.95313 50.43242, 6.95255 50.4... |
| 9 | None | NaN | 1.46e+10 | NaN | NaN | Watershed-Wirft | 3.94e+07 | None | None | None | NaN | None | None | None | NaN | None | NaN | None | None | None | NaN | None | NaN | None | None | None | None | NaN | None | NaN | None | None | MULTIPOLYGON (((6.85995 50.35750, 6.86005 50.3... |
| 10 | None | NaN | NaN | 1.0 | 6.54e+07 | Watershed-Wirft | 3.94e+07 | None | None | None | NaN | None | None | None | NaN | None | NaN | None | None | None | NaN | None | NaN | None | None | None | None | NaN | None | NaN | None | None | MULTIPOLYGON (((6.92917 50.34381, 6.92887 50.3... |
| 11 | Watershed-Nohner | 4.89e+07 | 1.46e+10 | NaN | NaN | None | NaN | None | None | None | NaN | None | None | None | NaN | None | NaN | None | None | None | NaN | None | NaN | None | None | None | None | NaN | None | NaN | None | None | MULTIPOLYGON (((6.82428 50.35194, 6.82428 50.3... |
| 12 | Watershed-Nohner | 4.89e+07 | NaN | NaN | NaN | None | NaN | None | None | None | NaN | None | None | None | NaN | None | NaN | None | None | None | NaN | None | NaN | None | None | None | None | NaN | None | NaN | None | None | POLYGON ((6.79358 50.36074, 6.79351 50.36074, ... |
| 13 | None | NaN | 1.46e+10 | NaN | NaN | None | NaN | None | None | None | NaN | None | None | None | NaN | None | NaN | None | None | None | NaN | None | NaN | None | None | None | None | NaN | None | NaN | None | None | POLYGON ((6.82404 50.35554, 6.82760 50.35932, ... |
| 14 | None | NaN | NaN | 1.0 | 6.54e+07 | None | NaN | None | None | None | NaN | None | None | None | NaN | None | NaN | None | None | None | NaN | None | NaN | None | None | None | None | NaN | None | NaN | None | None | POLYGON ((6.92729 50.44280, 6.93719 50.44457, ... |
| 15 | None | NaN | NaN | NaN | NaN | Watershed-Wirft | 3.94e+07 | None | None | None | NaN | None | None | None | NaN | None | NaN | None | None | None | NaN | None | NaN | None | None | None | None | NaN | None | NaN | None | None | POLYGON ((6.91722 50.33639, 6.91694 50.33639, ... |
| 16 | None | NaN | NaN | NaN | NaN | None | NaN | None | None | Watershed-Denn | 3.04e+07 | None | None | None | NaN | None | NaN | None | None | None | NaN | None | NaN | None | None | None | None | NaN | None | NaN | None | None | POLYGON ((6.96406 50.45953, 6.96406 50.45960, ... |
| 17 | None | NaN | NaN | NaN | NaN | None | NaN | None | None | None | NaN | None | None | None | 3.79e+07 | None | NaN | None | None | None | NaN | None | NaN | None | None | None | None | NaN | None | NaN | None | None | POLYGON ((7.00915 50.38663, 7.00559 50.38695, ... |
| 18 | None | NaN | NaN | NaN | NaN | None | NaN | None | None | None | NaN | None | None | None | NaN | Watershed-Kessel_Staf | 5.81e+07 | None | None | None | NaN | None | NaN | None | None | None | None | NaN | None | NaN | None | None | POLYGON ((7.03850 50.45608, 7.03847 50.45608, ... |
| 19 | None | NaN | NaN | NaN | NaN | None | NaN | None | None | None | NaN | None | None | None | NaN | None | NaN | None | None | UpperAhr_delin | NaN | None | NaN | None | None | None | None | NaN | None | NaN | None | None | POLYGON ((6.84334 50.27222, 6.84306 50.27222, ... |
| 20 | None | NaN | NaN | NaN | NaN | None | NaN | None | None | None | NaN | None | None | None | NaN | None | NaN | None | None | None | 1.0 | None | NaN | None | None | None | None | NaN | None | NaN | None | None | POLYGON ((6.69835 50.46917, 6.70552 50.47906, ... |
| 21 | None | NaN | NaN | NaN | NaN | None | NaN | None | None | None | NaN | None | None | None | NaN | None | NaN | None | None | None | NaN | Watershed-Ansbach | 2.62e+07 | None | None | None | None | NaN | None | NaN | None | None | POLYGON ((6.75266 50.44472, 6.75306 50.44472, ... |
| 22 | None | NaN | NaN | NaN | NaN | None | NaN | None | None | None | NaN | None | None | None | NaN | None | NaN | None | None | None | NaN | None | NaN | None | None | None | None | NaN | None | NaN | None | None | POLYGON ((6.86426 50.52006, 6.87475 50.51327, ... |
| 23 | None | NaN | NaN | NaN | NaN | None | NaN | None | None | None | NaN | None | None | None | NaN | None | NaN | None | None | None | NaN | None | NaN | None | None | None | None | 1.0 | None | NaN | None | None | POLYGON ((6.97541 50.50887, 6.92453 50.49237, ... |
| 24 | None | NaN | NaN | NaN | NaN | None | NaN | None | None | None | NaN | None | None | None | NaN | None | NaN | None | None | None | NaN | None | NaN | None | None | None | None | NaN | Watershed-Vischel | 3.24e+07 | None | None | POLYGON ((6.95083 50.52250, 6.95056 50.52250, ... |

geopandas.geodataframe.GeoDataFrame
<Geographic 2D CRS: EPSG:4258>
Name: ETRS89
Axis Info [ellipsoidal]:
- Lat[north]: Geodetic latitude (degree)
- Lon[east]: Geodetic longitude (degree)
Area of Use:
- name: Europe - onshore and offshore: Albania; Andorra; Austria; Belgium; Bosnia and Herzegovina; Bulgaria; Croatia; Cyprus; Czechia; Denmark; Estonia; Faroe Islands; Finland; France; Germany; Gibraltar; Greece; Hungary; Ireland; Italy; Kosovo; Latvia; Liechtenstein; Lithuania; Luxembourg; Malta; Moldova; Monaco; Montenegro; Netherlands; North Macedonia; Norway including Svalbard and Jan Mayen; Poland; Portugal; Romania; San Marino; Serbia; Slovakia; Slovenia; Spain; Sweden; Switzerland; United Kingdom (UK) including Channel Islands and Isle of Man; Vatican City State.
- bounds: (-16.1, 32.88, 40.18, 84.17)
Datum: European Terrestrial Reference System 1989
- Ellipsoid: GRS 1980
- Prime Meridian: Greenwich
1.0.3 Writing to Shapefile
The trick is the use a GeoSeries, not a GeoDF.
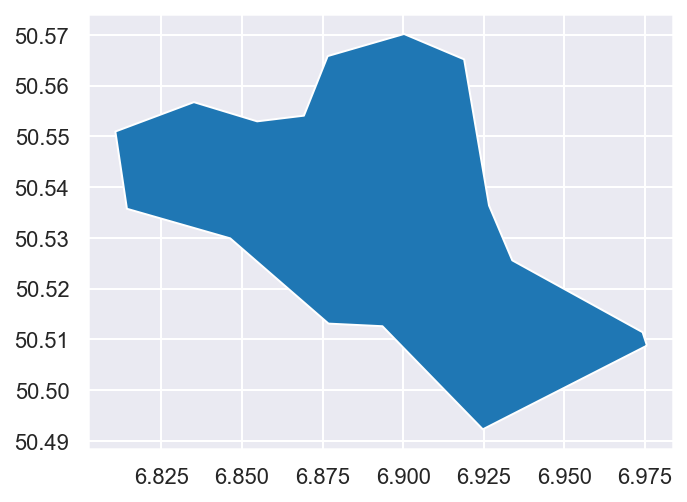
| Name | Area | geometry | |
|---|---|---|---|
| 0 | Watershed-1 residual | 28772994 | POLYGON ((6.940 50.456, 6.945 50.458, 6.939 50... |
| 1 | Watershed-1-1 | 850805542 | POLYGON ((6.930 50.453, 6.930 50.453, 6.940 50... |
| 2 | Watershed-1 | 103493493 | POLYGON ((6.985 50.517, 6.986 50.517, 6.988 50... |
| 3 | Watershed-2 residual | 702957502 | POLYGON ((352601.717 5603769.296, 352626.249 5... |
| 4 | Watershed-2-1 | 46040474 | POLYGON ((350595.148 5597153.059, 350595.148 5... |
| 5 | Watershed-2 | 748925746 | POLYGON ((345806.323 5597979.719, 345830.855 5... |
| 6 | Watershed-MiddleAhrvalley | 59021317 | POLYGON ((343698.322 5585916.143, 345362.956 5... |
Sahr_ws_delin.plot();
Name                                            Watershed-2-1
Area                                                 46040474
geometry    POLYGON ((350595.1477082021 5597153.058980878,...
Name: 4, dtype: object
geopandas.geodataframe.GeoDataFrame
<Projected CRS: EPSG:32632>
Name: WGS 84 / UTM zone 32N
Axis Info [cartesian]:
- E[east]: Easting (metre)
- N[north]: Northing (metre)
Area of Use:
- name: Between 6°E and 12°E, northern hemisphere between equator and 84°N, onshore and offshore. Algeria. Austria. Cameroon. Denmark. Equatorial Guinea. France. Gabon. Germany. Italy. Libya. Liechtenstein. Monaco. Netherlands. Niger. Nigeria. Norway. Sao Tome and Principe. Svalbard. Sweden. Switzerland. Tunisia. Vatican City State.
- bounds: (6.0, 0.0, 12.0, 84.0)
Coordinate Operation:
- name: UTM zone 32N
- method: Transverse Mercator
Datum: World Geodetic System 1984
- Ellipsoid: WGS 84
- Prime Meridian: Greenwich
| Name | Area | geometry | |
|---|---|---|---|
| 0 | Watershed-1 residual | 28772994 | POLYGON ((6.940 50.456, 6.945 50.458, 6.939 50... |
| 1 | Watershed-1-1 | 850805542 | POLYGON ((6.930 50.453, 6.930 50.453, 6.940 50... |
| 2 | Watershed-1 | 103493493 | POLYGON ((6.985 50.517, 6.986 50.517, 6.988 50... |
| 3 | Watershed-2 residual | 702957502 | POLYGON ((352601.717 5603769.296, 352626.249 5... |
| 4 | Watershed-2-1 | 46040474 | POLYGON ((350595.148 5597153.059, 350595.148 5... |
| 5 | Watershed-2 | 748925746 | POLYGON ((345806.323 5597979.719, 345830.855 5... |
| 6 | Watershed-MiddleAhrvalley | 59021317 | POLYGON ((343698.322 5585916.143, 345362.956 5... |
Finally the Sahrbach shapefile is OK again, and the shape of the Upper and Mid Ahr is corrected as well.


pandas.core.series.Series
Name                                       Watershed-Sahrbach
Area                                                 45600000
geometry    POLYGON ((6.9613972476 50.515177182, 6.9614691...
Name: 1, dtype: object
1.0.3.1 Pluviometer locations
{'geometry': [<shapely.geometry.point.Point at 0x29f97e00af0>,
  <shapely.geometry.point.Point at 0x29f957def10>,
  <shapely.geometry.point.Point at 0x29f95be3520>,
  <shapely.geometry.point.Point at 0x29f95ec5190>,
  <shapely.geometry.point.Point at 0x29f95ec51f0>,
  <shapely.geometry.point.Point at 0x29f95ec5220>]}
dict
0    POINT (6.98111 50.48833)
1    POINT (6.85500 50.53354)
Name: geometry, dtype: geometry
0    POINT (6.86763 50.35999)
1    POINT (6.79389 50.26361)
2    POINT (7.03000 50.56000)
3    POINT (6.73948 50.41555)
4    POINT (7.01427 50.40470)
5    POINT (7.11314 50.55130)
Name: geometry, dtype: geometry
geopandas.geoseries.GeoSeries
UpperAhr_delin    POLYGON ((6.84334 50.27222, 6.84306 50.27222, ...
dtype: geometry
1.0.4 Building a Pluviometer GeoDataFrame
| Latitude | Longitude | Height | |
|---|---|---|---|
| Pluviometer | |||
| Barweiler | 50.36 | 6.87 | 488.17 |
| Freilingen | 50.42 | 6.74 | 530.00 |
| Neuenahr | 50.55 | 7.11 | 130.00 |
| Dreis-Brück | 50.26 | 6.79 | 525.00 |
| Kaltenborn | 50.40 | 7.01 | 541.00 |
| Esch | 50.56 | 7.03 | 274.00 |
| Ahrbrück | 50.49 | 6.98 | 192.00 |
| Scheuerheck | 50.53 | 6.86 | 435.00 |
Index(['Barweiler', 'Freilingen', 'Neuenahr', 'Dreis-Brück', 'Kaltenborn',
       'Esch', 'Ahrbrück', 'Scheuerheck'],
      dtype='object', name='Pluviometer')
0      Barweiler
1     Freilingen
2       Neuenahr
3    Dreis-Brück
4     Kaltenborn
5           Esch
6       Ahrbrück
7    Scheuerheck
Name: Pluviometer, dtype: object
pandas.core.series.Series
Pluviometer
Barweiler      None
Dreis-Brück    None
Esch           None
Freilingen     None
Kaltenborn     None
Neuenahr       None
Name: geometry, dtype: geometry
| geometry | |
|---|---|
| 0 | POINT (6.86763 50.35999) |
| 1 | POINT (6.79389 50.26361) |
| 2 | POINT (7.03000 50.56000) |
| 3 | POINT (6.73948 50.41555) |
| 4 | POINT (7.01427 50.40470) |
| 5 | POINT (7.11314 50.55130) |
| geometry | |
|---|---|
| Ahrbrück | POINT (6.98111 50.48833) |
| Scheuerheck | POINT (6.85500 50.53354) |
| geometry | Pluviometer | Latitude | Longitude | Height | |
|---|---|---|---|---|---|
| 6 | POINT (6.98111 50.48833) | Ahrbrück | 50.49 | 6.98 | 192.0 |
| 7 | POINT (6.85500 50.53354) | Scheuerheck | 50.53 | 6.86 | 435.0 |
| Pluviometer | Latitude | Longitude | Height | |
|---|---|---|---|---|
| 0 | Barweiler | 50.36 | 6.87 | 488.17 |
| 1 | Freilingen | 50.42 | 6.74 | 530.00 |
| 2 | Neuenahr | 50.55 | 7.11 | 130.00 |
| 3 | Dreis-Brück | 50.26 | 6.79 | 525.00 |
| 4 | Kaltenborn | 50.40 | 7.01 | 541.00 |
| 5 | Esch | 50.56 | 7.03 | 274.00 |
| 6 | Ahrbrück | 50.49 | 6.98 | 192.00 |
| 7 | Scheuerheck | 50.53 | 6.86 | 435.00 |
add index, rainfall and elevation info...
| geometry | |
|---|---|
| 0 | POINT (6.86763 50.35999) |
| 1 | POINT (6.79389 50.26361) |
| 2 | POINT (7.03000 50.56000) |
| 3 | POINT (6.73948 50.41555) |
| 4 | POINT (7.01427 50.40470) |
| 5 | POINT (7.11314 50.55130) |
C:\Users\Kurt\AppData\Local\Temp/ipykernel_8916/2434726898.py:1: UserWarning: Column names longer than 10 characters will be truncated when saved to ESRI Shapefile.
  pluvio_geometriedfX.to_file(r"C:\Users\Kurt\Documents\Lekan\pluvio_geometrie.shp")
c:\program files\python38\lib\site-packages\geopandas\_compat.py:111: UserWarning: The Shapely GEOS version (3.10.1-CAPI-1.16.0) is incompatible with the GEOS version PyGEOS was compiled with (3.10.0-CAPI-1.16.0). Conversions between both will be slow.
  warnings.warn(
| Pluviomete | Latitude | Longitude | Height | SUM1407 | geometry | |
|---|---|---|---|---|---|---|
| 0 | Barweiler | 50.36 | 6.87 | 488.17 | 80.00 | POINT (6.86763 50.35999) |
| 1 | Dreis-Brück | 50.26 | 6.79 | 525.00 | 102.60 | POINT (6.79389 50.26361) |
| 2 | Esch | 50.56 | 7.03 | 274.00 | 89.10 | POINT (7.03000 50.56000) |
| 3 | Freilingen | 50.42 | 6.74 | 530.00 | 115.45 | POINT (6.73948 50.41555) |
| 4 | Kaltenborn | 50.40 | 7.01 | 541.00 | 79.23 | POINT (7.01427 50.40470) |
| 5 | Neuenahr | 50.55 | 7.11 | 130.00 | 67.20 | POINT (7.11314 50.55130) |
concatenate the original df with additions df
| Pluviometer | Latitude | Longitude | Height | SUM1407 | geometry | |
|---|---|---|---|---|---|---|
| 0 | Barweiler | 50.36 | 6.87 | 488.17 | 80.00 | POINT (6.86763 50.35999) |
| 1 | Dreis-Brück | 50.26 | 6.79 | 525.00 | 102.60 | POINT (6.79389 50.26361) |
| 2 | Esch | 50.56 | 7.03 | 274.00 | 89.10 | POINT (7.03000 50.56000) |
| 3 | Freilingen | 50.42 | 6.74 | 530.00 | 115.45 | POINT (6.73948 50.41555) |
| 4 | Kaltenborn | 50.40 | 7.01 | 541.00 | 79.23 | POINT (7.01427 50.40470) |
| 5 | Neuenahr | 50.55 | 7.11 | 130.00 | 67.20 | POINT (7.11314 50.55130) |
| 6 | Ahrbrück | 50.49 | 6.98 | 192.00 | NaN | POINT (6.98111 50.48833) |
| 7 | Scheuerheck | 50.53 | 6.86 | 435.00 | NaN | POINT (6.85500 50.53354) |
C:\Users\Kurt\AppData\Local\Temp/ipykernel_18920/3817314484.py:1: UserWarning: Column names longer than 10 characters will be truncated when saved to ESRI Shapefile.
  pluvio_geometriedf8.to_file(r"C:\Users\Kurt\Documents\Lekan\pluvio_geometrie8.shp")
1.0.4.1 Map of rainfall gauges with IDW interpolation.
1.0.5 Building an outlet points GeoDataFrame
[6.944930767512368, 50.459138381369975] [6.97, 50.51]
{'geometry': [<shapely.geometry.point.Point at 0x26b74bbdaf0>,
  <shapely.geometry.point.Point at 0x26b732e7070>,
  <shapely.geometry.point.Point at 0x26b74cf69a0>,
  <shapely.geometry.point.Point at 0x26b74bb1820>,
  <shapely.geometry.point.Point at 0x26b74820a00>,
  <shapely.geometry.point.Point at 0x26b73271b80>,
  <shapely.geometry.point.Point at 0x26b73271f70>,
  <shapely.geometry.point.Point at 0x26b74cdee50>,
  <shapely.geometry.point.Point at 0x26b74a4c670>,
  <shapely.geometry.point.Point at 0x26b74bbdd00>,
  <shapely.geometry.point.Point at 0x26b74bbdb50>,
  <shapely.geometry.point.Point at 0x26b74bbdc70>]}
| geometry | |
|---|---|
| 0 | POINT (6.97000 50.51000) |
| 1 | POINT (6.94493 50.45914) |
| 2 | POINT (7.02543 50.48225) |
| 3 | POINT (6.86918 50.45092) |
| 4 | POINT (6.85482 50.43257) |
| 5 | POINT (6.82811 50.36239) |
| 6 | POINT (6.83068 50.36311) |
| 7 | POINT (6.84294 50.37133) |
| 8 | POINT (6.93399 50.44348) |
| 9 | POINT (6.98600 50.47694) |
| 10 | POINT (6.97600 50.51162) |
| 11 | POINT (6.81000 50.38000) |
| geometry | Bach | Streamcode | |
|---|---|---|---|
| Stream | |||
| Sahr | POINT (6.97000 50.51000) | Sahrbach | 27188 |
| Liers | POINT (6.94493 50.45914) | Liersbach | 271872 |
| Armuths | POINT (7.02543 50.48225) | Armuthsbach | 271856 |
| Ans | POINT (6.86918 50.45092) | Ansbach | 271854 |
| Nohner | POINT (6.85482 50.43257) | Nohnerbach | 271812 |
| Trier | POINT (6.82811 50.36239) | Trierbach | 27184 |
| Wirft | POINT (6.83068 50.36311) | Wirftbach | 271899 |
| Adenauer | POINT (6.84294 50.37133) | Adenauerbach | 27186 |
| Denn | POINT (6.93399 50.44348) | Dennbach | 2718748 |
| Staffel | POINT (6.98600 50.47694) | Staffelbach | 271874 |
| Vischel | POINT (6.97600 50.51162) | Vischelbach | 271892 |
| UpperAhr | POINT (6.81000 50.38000) | UpperAhr | 27182 |
| Stream | geometry | Bach | Streamcode | |
|---|---|---|---|---|
| 0 | Sahr | POINT (6.97000 50.51000) | Sahrbach | 27188 |
| 1 | Liers | POINT (6.94493 50.45914) | Liersbach | 271872 |
| 2 | Armuths | POINT (7.02543 50.48225) | Armuthsbach | 271856 |
| 3 | Ans | POINT (6.86918 50.45092) | Ansbach | 271854 |
| 4 | Nohner | POINT (6.85482 50.43257) | Nohnerbach | 271812 |
| 5 | Trier | POINT (6.82811 50.36239) | Trierbach | 27184 |
| 6 | Wirft | POINT (6.83068 50.36311) | Wirftbach | 271899 |
| 7 | Adenauer | POINT (6.84294 50.37133) | Adenauerbach | 27186 |
| 8 | Denn | POINT (6.93399 50.44348) | Dennbach | 2718748 |
| 9 | Staffel | POINT (6.98600 50.47694) | Staffelbach | 271874 |
| 10 | Vischel | POINT (6.97600 50.51162) | Vischelbach | 271892 |
| 11 | UpperAhr | POINT (6.81000 50.38000) | UpperAhr | 27182 |
geopandas.geodataframe.GeoDataFrame
geopandas.geodataframe.GeoDataFrame
1.0.5.1 fiona: supported_drivers
{'AeronavFAA': 'r',
 'ARCGEN': 'r',
 'BNA': 'rw',
 'DXF': 'rw',
 'CSV': 'raw',
 'OpenFileGDB': 'r',
 'ESRIJSON': 'r',
 'ESRI Shapefile': 'raw',
 'FlatGeobuf': 'rw',
 'GeoJSON': 'raw',
 'GeoJSONSeq': 'rw',
 'GPKG': 'raw',
 'GML': 'rw',
 'OGR_GMT': 'rw',
 'GPX': 'rw',
 'GPSTrackMaker': 'rw',
 'Idrisi': 'r',
 'MapInfo File': 'raw',
 'DGN': 'raw',
 'PCIDSK': 'rw',
 'OGR_PDS': 'r',
 'S57': 'r',
 'SEGY': 'r',
 'SUA': 'r',
 'TopoJSON': 'r'}
1.0.5.2 Variable $GMT_CACHEDIR
may point to a directory where the user places cached data files downloaded from the GMT data server.
When \C GMT_CACHEDIR is not defined, then the default value \C
HOME/.gmt/cache will be assumed. The cache directory can be emptied by
running gmt gmt clear cache.
<pygmt.src.config.config at 0x1f00b5fc2b0>
Het systeem kan het opgegeven pad niet vinden.
gmt gmtget [core] 6.2.0 [64-bit] [MP] - Get individual GMT default settings or download data sets

usage: gmt gmtget [-D<download>] [-G<defaultsfile>] [-I<inc>] [-L] [-N] [-Q] [PARAMETER1 PARAMETER2 PARAMETER3 ...] [-V[<level>]]

	For available PARAMETERS, see gmt.conf man page
	OPTIONS:
	-D Download data from the selected GMT server [oceania]
	    Append one of the directories to download:
	      cache: The entire contents of the cache directory.
	      data: The entire contents of the data directory.
	        Append =<planet> to only download the data/<planet> directory.
	        Append =<dataset1,dataset2...> to only download the stated datasets.
	    -Dall downloads both cache and all datasets.
	    Run "gmt docs data" to learn about available data sets.
	-G Set name of specific gmt.conf file to process.
	   [Default looks for file in current directory.  If not found,
	   it looks in the home directory, if not found it uses the GMT defaults].
	-I Limit the download of data sets to grid spacings of <inc> or larger [0].
	-L Write one parameter value per line [Default writes all on one line].
	-N Do NOT convert grids downloaded with -D to netCDF but leave as JP2.
	-Q In conjunction with -D, will list but not download the selected data.
	-V Change the verbosity level (currently t).
	   Choose among 7 levels; each level adds more messages:
	     q - Quiet, not even fatal error messages.
	     e - Error messages only.
	     w - Warnings [Default].
	     t - Timings (time-intensive operations only).
	     i - Informational messages (or just -V).
	     c - Compatibility warnings.
	     d - Debugging messages.
	-^ (or -) Print short synopsis message.
	-+ (or +) Print longer synopsis message.
	-? (or no arguments) Print this usage message.
	--PAR=<value> Temporarily override GMT default setting(s) (repeatable).
	(See gmt.conf man page for GMT default parameters).
'gmt.conf' is not recognized as an internal or external command,
operable program or batch file.
Index(['Bach', 'Distance', 'Lati', 'Long', 'Latitude', 'Longitude'], dtype='object')
| Flow rate (m³/s)Ans | |
|---|---|
| Time_lag | |
| 2021-06-10 00:46:00 | 0.0 |
| 2021-06-10 01:20:00 | 0.0 |
| 2021-06-10 01:35:00 | 0.0 |
| 2021-06-10 01:46:00 | 0.0 |
| 2021-06-10 01:50:00 | 0.0 |
| ... | ... |
| 2021-10-13 16:54:00 | 0.0 |
| 2021-10-13 17:09:00 | 0.0 |
| 2021-10-13 17:16:00 | 0.0 |
| 2021-10-13 17:24:00 | 0.0 |
| 2021-10-13 17:39:00 | 0.0 |
29436 rows × 1 columns
| Flow rate (m³/s)Ans | Name | |
|---|---|---|
| Time_lag | ||
| 2021-06-10 00:46:00 | 0.0 | Ans |
| 2021-06-10 01:20:00 | 0.0 | Ans |
| 2021-06-10 01:35:00 | 0.0 | Ans |
| 2021-06-10 01:46:00 | 0.0 | Ans |
| 2021-06-10 01:50:00 | 0.0 | Ans |
| ... | ... | ... |
| 2021-10-13 16:54:00 | 0.0 | Ans |
| 2021-10-13 17:09:00 | 0.0 | Ans |
| 2021-10-13 17:16:00 | 0.0 | Ans |
| 2021-10-13 17:24:00 | 0.0 | Ans |
| 2021-10-13 17:39:00 | 0.0 | Ans |
29436 rows × 2 columns
1.0.6 Land Use Proportional.xlsx
I'll merge this land use table with a table containing distances and geometrical info, so I can plot a map.
| Mid Ahr | UpperAhr | Armuthsbach | Sahrbach | Trierbach | Adenauerbach | Staffelbach | Weidenbach | Nohnerbach | Liersbach | Dennbach | Wirftbach | Ansbach | Vischelbach | Rivervalley | Unnamed: 16 | Unnamed: 17 | |
|---|---|---|---|---|---|---|---|---|---|---|---|---|---|---|---|---|---|
| Land Use | |||||||||||||||||
| agriculture | 0.09 | 0.14 | 0.14 | 0.09 | 0.11 | 2.23e-02 | 3.05e-02 | 4.28e-03 | 0.15 | 4.49e-02 | 3.30e-03 | 0.10 | 4.97e-02 | 0.05 | 0.08 | 53565.0 | 0.08 |
| grassland | 0.30 | 0.40 | 0.32 | 0.26 | 0.36 | 2.15e-01 | 2.58e-01 | 1.76e-01 | 0.32 | 2.00e-01 | 7.66e-02 | 0.31 | 2.42e-01 | 0.27 | 0.24 | 162796.0 | 0.24 |
| forest | 0.56 | 0.41 | 0.51 | 0.61 | 0.47 | 7.24e-01 | 6.96e-01 | 8.05e-01 | 0.49 | 7.40e-01 | 9.06e-01 | 0.54 | 6.85e-01 | 0.62 | 0.62 | 416011.0 | 0.62 |
| build | 0.03 | 0.03 | 0.02 | 0.03 | 0.04 | 3.57e-02 | 1.09e-02 | 8.79e-03 | 0.02 | 8.65e-03 | 6.26e-03 | 0.04 | 1.57e-02 | 0.01 | 0.03 | 22432.0 | 0.03 |
| bare_soils | 0.01 | 0.02 | 0.01 | 0.01 | 0.01 | 4.95e-03 | 5.21e-03 | 5.95e-03 | 0.02 | 6.30e-03 | 8.11e-03 | 0.02 | 8.11e-03 | 0.01 | 0.01 | 7335.0 | 0.01 |
| slope | 0.40 | 0.52 | 1.08 | 1.06 | 0.84 | 1.70e+00 | 1.67e+00 | 2.33e+00 | 0.96 | 2.30e+00 | 1.68e+00 | 1.49 | 1.37e+00 | 1.45 | 0.40 | 6893.0 | nodata |
| slope_2 | 0.53 | 1.08 | 1.71 | 1.50 | 1.03 | 1.79e+00 | 2.99e+00 | 2.43e+00 | 1.56 | 1.99e+00 | 4.10e+00 | 2.30 | 2.50e+00 | 1.66 | 0.44 | NaN | NaN |
| Land Use | agriculture | grassland | forest | build | bare_soils | slope | slope_2 |
|---|---|---|---|---|---|---|---|
| Mid Ahr | 0.09 | 0.3 | 0.56 | 0.03 | 0.01 | 0.4 | 0.53 |
| UpperAhr | 0.14 | 0.4 | 0.41 | 0.03 | 0.02 | 0.52 | 1.08 |
| Armuthsbach | 0.14 | 0.32 | 0.51 | 0.02 | 0.01 | 1.08 | 1.71 |
| Sahrbach | 0.09 | 0.26 | 0.61 | 0.03 | 0.01 | 1.06 | 1.5 |
| Trierbach | 0.11 | 0.36 | 0.47 | 0.04 | 0.01 | 0.84 | 1.03 |
| Adenauerbach | 0.02 | 0.22 | 0.72 | 0.04 | 0.0 | 1.7 | 1.79 |
| Staffelbach | 0.03 | 0.26 | 0.7 | 0.01 | 0.01 | 1.67 | 2.99 |
| Weidenbach | 0.0 | 0.18 | 0.8 | 0.01 | 0.01 | 2.33 | 2.43 |
| Nohnerbach | 0.15 | 0.32 | 0.49 | 0.02 | 0.02 | 0.96 | 1.56 |
| Liersbach | 0.04 | 0.2 | 0.74 | 0.01 | 0.01 | 2.3 | 1.99 |
| Dennbach | 0.0 | 0.08 | 0.91 | 0.01 | 0.01 | 1.68 | 4.1 |
| Wirftbach | 0.1 | 0.31 | 0.54 | 0.04 | 0.02 | 1.49 | 2.3 |
| Ansbach | 0.05 | 0.24 | 0.68 | 0.02 | 0.01 | 1.37 | 2.5 |
| Vischelbach | 0.05 | 0.27 | 0.62 | 0.01 | 0.01 | 1.45 | 1.66 |
| Rivervalley | 0.08 | 0.24 | 0.62 | 0.03 | 0.01 | 0.4 | 0.44 |
| Unnamed: 16 | 53565.0 | 162796.0 | 416011.0 | 22432.0 | 7335.0 | 6893.0 | NaN |
| Unnamed: 17 | 0.08 | 0.24 | 0.62 | 0.03 | 0.01 | nodata | NaN |
| agriculture | grassland | forest | build | bare_soils | slope | slope_2 | Bach | Distance | Lati | Long | Latitude | Longitude | Streamcode | |
|---|---|---|---|---|---|---|---|---|---|---|---|---|---|---|
| Stream | ||||||||||||||
| UpperAhr | 0.14 | 0.4 | 0.41 | 0.03 | 0.02 | 0.52 | 1.08 | UpperAhr | 34.20 | 50.38 | 6.81 | 50.44 | 6.65 | 27181 |
| Armuths | 0.14 | 0.32 | 0.51 | 0.02 | 0.01 | 1.08 | 1.71 | Armuthsbach | 18.80 | 50.45 | 6.87 | 50.47 | 6.71 | 271856 |
| Sahr | 0.09 | 0.26 | 0.61 | 0.03 | 0.01 | 1.06 | 1.5 | Sahrbach | 2.17 | 50.51 | 6.97 | 50.54 | 6.85 | 27188 |
| Trier | 0.11 | 0.36 | 0.47 | 0.04 | 0.01 | 0.84 | 1.03 | Trierbach | 34.00 | 50.36 | 6.83 | 50.30 | 6.91 | 27184 |
| Adenauer | 0.02 | 0.22 | 0.72 | 0.04 | 0.0 | 1.7 | 1.79 | Adenauerbach | 11.20 | 50.44 | 6.93 | 50.35 | 6.97 | 27186 |
| Staffel | 0.03 | 0.26 | 0.7 | 0.01 | 0.01 | 1.67 | 2.99 | Staffelbach | 10.20 | 50.48 | 7.03 | 50.46 | 7.11 | 271874 |
| Weiden | 0.0 | 0.18 | 0.8 | 0.01 | 0.01 | 2.33 | 2.43 | Weidenbach | 8.30 | 50.48 | 7.02 | 50.39 | 7.03 | 2718741 |
| Nohner | 0.15 | 0.32 | 0.49 | 0.02 | 0.02 | 0.96 | 1.56 | Nohnerbach | 35.50 | 50.36 | 6.83 | 50.28 | 6.88 | 271812 |
| Liers | 0.04 | 0.2 | 0.74 | 0.01 | 0.01 | 2.3 | 1.99 | Liersbach | 10.00 | 50.46 | 6.94 | 50.53 | 6.83 | 271872 |
| Denn | 0.0 | 0.08 | 0.91 | 0.01 | 0.01 | 1.68 | 4.1 | Dennbach | 6.30 | 50.48 | 6.99 | 50.42 | 6.97 | 2718748 |
| Wirft | 0.1 | 0.31 | 0.54 | 0.04 | 0.02 | 1.49 | 2.3 | Wirftbach | 22.00 | 50.37 | 6.84 | 50.34 | 6.93 | 271899 |
| Ans | 0.05 | 0.24 | 0.68 | 0.02 | 0.01 | 1.37 | 2.5 | Ansbach | 22.00 | 50.43 | 6.85 | 50.44 | 6.75 | 271854 |
| Vischel | 0.05 | 0.27 | 0.62 | 0.01 | 0.01 | 1.45 | 1.66 | Vischelbach | 1.00 | 50.51 | 6.98 | 50.57 | 6.94 | 271892 |
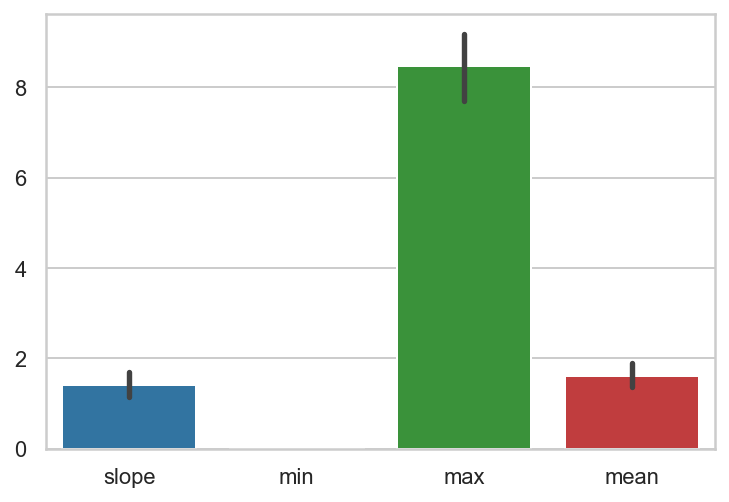
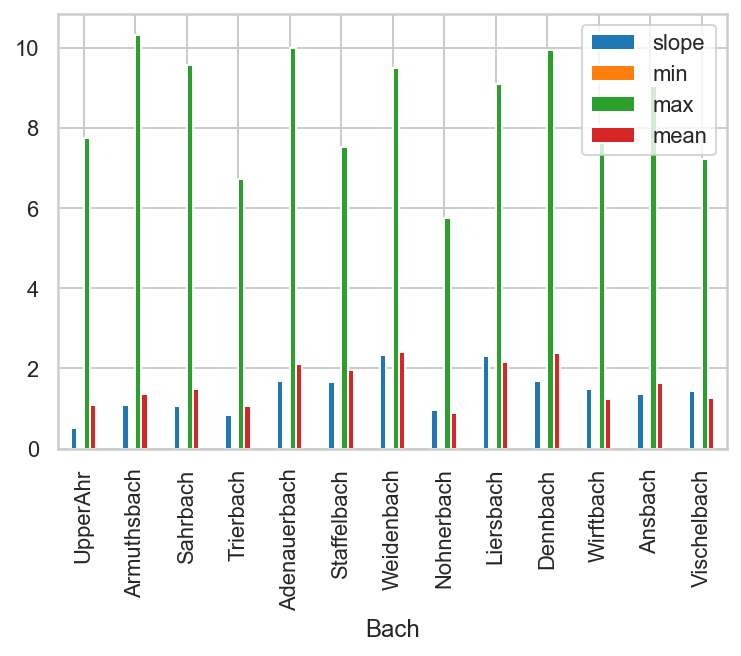
1.0.6.1 Adding the "min" ,"max","mean" of the slopes of the drainage area's.
C:\Program Files\Python38\lib\site-packages\geopandas\_compat.py:111: UserWarning: The Shapely GEOS version (3.10.1-CAPI-1.16.0) is incompatible with the GEOS version PyGEOS was compiled with (3.10.0-CAPI-1.16.0). Conversions between both will be slow.
  warnings.warn(
| zone | m² | sum | count | min | max | mean | geometry | |
|---|---|---|---|---|---|---|---|---|
| 0 | 27181 | 2.52e+08 | 5.14e+11 | 474197 | 0.00 | 7.76e+06 | 1.08e+06 | None |
| 1 | 271899 | 2.48e+07 | 5.82e+10 | 46641 | 4814.83 | 7.69e+06 | 1.25e+06 | None |
| 2 | 2718741 | 3.71e+07 | 1.68e+11 | 69621 | 16775.95 | 9.49e+06 | 2.41e+06 | None |
| 3 | 271812 | 3.16e+07 | 5.27e+10 | 59435 | 3169.89 | 5.75e+06 | 8.86e+05 | None |
| 4 | 271892 | 1.89e+07 | 4.47e+10 | 35467 | 4745.09 | 7.21e+06 | 1.26e+06 | None |
| 5 | 2718748 | 1.92e+07 | 8.56e+10 | 36061 | 17462.82 | 9.95e+06 | 2.38e+06 | None |
| 6 | 271874 | 3.70e+07 | 1.36e+11 | 69550 | 4245.12 | 7.51e+06 | 1.95e+06 | None |
| 7 | 27184 | 5.55e+07 | 1.10e+11 | 104321 | 5898.14 | 6.73e+06 | 1.06e+06 | None |
| 8 | 271856 | 7.29e+07 | 1.87e+11 | 136895 | 1281.80 | 1.03e+07 | 1.36e+06 | None |
| 9 | 271854 | 1.46e+07 | 4.47e+10 | 27419 | 12871.94 | 9.03e+06 | 1.63e+06 | None |
| 10 | 27186 | 5.70e+07 | 2.25e+11 | 107100 | 4360.62 | 9.98e+06 | 2.10e+06 | None |
| 11 | 27188 | 4.60e+07 | 1.28e+11 | 86330 | 3245.12 | 9.56e+06 | 1.48e+06 | None |
| 12 | 271872 | 2.64e+07 | 1.07e+11 | 49517 | 8374.52 | 9.08e+06 | 2.15e+06 | None |
C:\Users\Kurt\AppData\Local\Temp/ipykernel_12488/1758689715.py:2: SettingWithCopyWarning:
A value is trying to be set on a copy of a slice from a DataFrame.
Try using .loc[row_indexer,col_indexer] = value instead

See the caveats in the documentation: https://pandas.pydata.org/pandas-docs/stable/user_guide/indexing.html#returning-a-view-versus-a-copy
  catch_slope["min" ]= catch_slope["min" ] /1000000   # convers. to %
C:\Users\Kurt\AppData\Local\Temp/ipykernel_12488/1758689715.py:3: SettingWithCopyWarning:
A value is trying to be set on a copy of a slice from a DataFrame.
Try using .loc[row_indexer,col_indexer] = value instead

See the caveats in the documentation: https://pandas.pydata.org/pandas-docs/stable/user_guide/indexing.html#returning-a-view-versus-a-copy
  catch_slope["max" ]= catch_slope["max"] /1000000
C:\Users\Kurt\AppData\Local\Temp/ipykernel_12488/1758689715.py:4: SettingWithCopyWarning:
A value is trying to be set on a copy of a slice from a DataFrame.
Try using .loc[row_indexer,col_indexer] = value instead

See the caveats in the documentation: https://pandas.pydata.org/pandas-docs/stable/user_guide/indexing.html#returning-a-view-versus-a-copy
  catch_slope["mean" ]= catch_slope["mean"] /1000000
C:\Users\Kurt\AppData\Local\Temp/ipykernel_12488/1758689715.py:5: SettingWithCopyWarning:
A value is trying to be set on a copy of a slice from a DataFrame.
Try using .loc[row_indexer,col_indexer] = value instead

See the caveats in the documentation: https://pandas.pydata.org/pandas-docs/stable/user_guide/indexing.html#returning-a-view-versus-a-copy
  catch_slope["zone"]= catch_slope["zone"].astype('int32')
| zone | min | max | mean | |
|---|---|---|---|---|
| 0 | 27181 | 0.00e+00 | 7.76 | 1.08 |
| 1 | 271899 | 4.81e-03 | 7.69 | 1.25 |
| 2 | 2718741 | 1.68e-02 | 9.49 | 2.41 |
| 3 | 271812 | 3.17e-03 | 5.75 | 0.89 |
| 4 | 271892 | 4.75e-03 | 7.21 | 1.26 |
| 5 | 2718748 | 1.75e-02 | 9.95 | 2.38 |
| 6 | 271874 | 4.25e-03 | 7.51 | 1.95 |
| 7 | 27184 | 5.90e-03 | 6.73 | 1.06 |
| 8 | 271856 | 1.28e-03 | 10.33 | 1.36 |
| 9 | 271854 | 1.29e-02 | 9.03 | 1.63 |
| 10 | 27186 | 4.36e-03 | 9.98 | 2.10 |
| 11 | 27188 | 3.25e-03 | 9.56 | 1.48 |
| 12 | 271872 | 8.37e-03 | 9.08 | 2.15 |
| agriculture | grassland | forest | build | bare_soils | slope | slope_2 | Bach | Distance | Lati | Long | Latitude | Longitude | Streamcode | zone | min | max | mean | |
|---|---|---|---|---|---|---|---|---|---|---|---|---|---|---|---|---|---|---|
| 0 | 0.14 | 0.4 | 0.41 | 0.03 | 0.02 | 0.52 | 1.08 | UpperAhr | 34.20 | 50.38 | 6.81 | 50.44 | 6.65 | 27181 | 27181 | 0.00e+00 | 7.76 | 1.08 |
| 1 | 0.14 | 0.32 | 0.51 | 0.02 | 0.01 | 1.08 | 1.71 | Armuthsbach | 18.80 | 50.45 | 6.87 | 50.47 | 6.71 | 271856 | 271856 | 1.28e-03 | 10.33 | 1.36 |
| 2 | 0.09 | 0.26 | 0.61 | 0.03 | 0.01 | 1.06 | 1.5 | Sahrbach | 2.17 | 50.51 | 6.97 | 50.54 | 6.85 | 27188 | 27188 | 3.25e-03 | 9.56 | 1.48 |
| 3 | 0.11 | 0.36 | 0.47 | 0.04 | 0.01 | 0.84 | 1.03 | Trierbach | 34.00 | 50.36 | 6.83 | 50.30 | 6.91 | 27184 | 27184 | 5.90e-03 | 6.73 | 1.06 |
| 4 | 0.02 | 0.22 | 0.72 | 0.04 | 0.0 | 1.7 | 1.79 | Adenauerbach | 11.20 | 50.44 | 6.93 | 50.35 | 6.97 | 27186 | 27186 | 4.36e-03 | 9.98 | 2.10 |
| 5 | 0.03 | 0.26 | 0.7 | 0.01 | 0.01 | 1.67 | 2.99 | Staffelbach | 10.20 | 50.48 | 7.03 | 50.46 | 7.11 | 271874 | 271874 | 4.25e-03 | 7.51 | 1.95 |
| 6 | 0.0 | 0.18 | 0.8 | 0.01 | 0.01 | 2.33 | 2.43 | Weidenbach | 8.30 | 50.48 | 7.02 | 50.39 | 7.03 | 2718741 | 2718741 | 1.68e-02 | 9.49 | 2.41 |
| 7 | 0.15 | 0.32 | 0.49 | 0.02 | 0.02 | 0.96 | 1.56 | Nohnerbach | 35.50 | 50.36 | 6.83 | 50.28 | 6.88 | 271812 | 271812 | 3.17e-03 | 5.75 | 0.89 |
| 8 | 0.04 | 0.2 | 0.74 | 0.01 | 0.01 | 2.3 | 1.99 | Liersbach | 10.00 | 50.46 | 6.94 | 50.53 | 6.83 | 271872 | 271872 | 8.37e-03 | 9.08 | 2.15 |
| 9 | 0.0 | 0.08 | 0.91 | 0.01 | 0.01 | 1.68 | 4.1 | Dennbach | 6.30 | 50.48 | 6.99 | 50.42 | 6.97 | 2718748 | 2718748 | 1.75e-02 | 9.95 | 2.38 |
| 10 | 0.1 | 0.31 | 0.54 | 0.04 | 0.02 | 1.49 | 2.3 | Wirftbach | 22.00 | 50.37 | 6.84 | 50.34 | 6.93 | 271899 | 271899 | 4.81e-03 | 7.69 | 1.25 |
| 11 | 0.05 | 0.24 | 0.68 | 0.02 | 0.01 | 1.37 | 2.5 | Ansbach | 22.00 | 50.43 | 6.85 | 50.44 | 6.75 | 271854 | 271854 | 1.29e-02 | 9.03 | 1.63 |
| 12 | 0.05 | 0.27 | 0.62 | 0.01 | 0.01 | 1.45 | 1.66 | Vischelbach | 1.00 | 50.51 | 6.98 | 50.57 | 6.94 | 271892 | 271892 | 4.75e-03 | 7.21 | 1.26 |
| agriculture | grassland | forest | build | bare_soils | slope | slope_2 | Distance | Lati | Long | Latitude | Longitude | Streamcode | zone | min | max | mean | slopevalley_stream | |
|---|---|---|---|---|---|---|---|---|---|---|---|---|---|---|---|---|---|---|
| Bach | ||||||||||||||||||
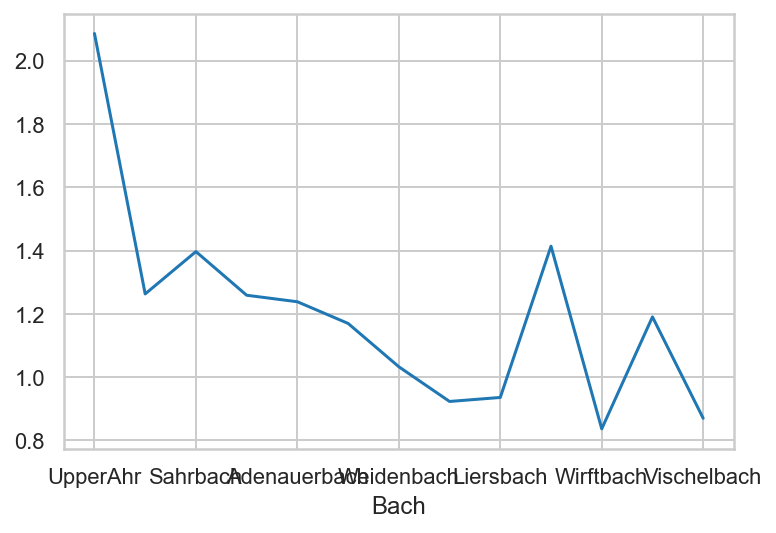
| UpperAhr | 0.14 | 0.4 | 0.41 | 0.03 | 0.02 | 0.52 | 1.08 | 34.20 | 50.38 | 6.81 | 50.44 | 6.65 | 27181 | 27181 | 0.00e+00 | 7.76 | 1.08 | 2.09 |
| Armuthsbach | 0.14 | 0.32 | 0.51 | 0.02 | 0.01 | 1.08 | 1.71 | 18.80 | 50.45 | 6.87 | 50.47 | 6.71 | 271856 | 271856 | 1.28e-03 | 10.33 | 1.36 | 1.26 |
| Sahrbach | 0.09 | 0.26 | 0.61 | 0.03 | 0.01 | 1.06 | 1.5 | 2.17 | 50.51 | 6.97 | 50.54 | 6.85 | 27188 | 27188 | 3.25e-03 | 9.56 | 1.48 | 1.4 |
| Trierbach | 0.11 | 0.36 | 0.47 | 0.04 | 0.01 | 0.84 | 1.03 | 34.00 | 50.36 | 6.83 | 50.30 | 6.91 | 27184 | 27184 | 5.90e-03 | 6.73 | 1.06 | 1.26 |
| Adenauerbach | 0.02 | 0.22 | 0.72 | 0.04 | 0.0 | 1.7 | 1.79 | 11.20 | 50.44 | 6.93 | 50.35 | 6.97 | 27186 | 27186 | 4.36e-03 | 9.98 | 2.10 | 1.24 |
| Staffelbach | 0.03 | 0.26 | 0.7 | 0.01 | 0.01 | 1.67 | 2.99 | 10.20 | 50.48 | 7.03 | 50.46 | 7.11 | 271874 | 271874 | 4.25e-03 | 7.51 | 1.95 | 1.17 |
| Weidenbach | 0.0 | 0.18 | 0.8 | 0.01 | 0.01 | 2.33 | 2.43 | 8.30 | 50.48 | 7.02 | 50.39 | 7.03 | 2718741 | 2718741 | 1.68e-02 | 9.49 | 2.41 | 1.03 |
| Nohnerbach | 0.15 | 0.32 | 0.49 | 0.02 | 0.02 | 0.96 | 1.56 | 35.50 | 50.36 | 6.83 | 50.28 | 6.88 | 271812 | 271812 | 3.17e-03 | 5.75 | 0.89 | 0.92 |
| Liersbach | 0.04 | 0.2 | 0.74 | 0.01 | 0.01 | 2.3 | 1.99 | 10.00 | 50.46 | 6.94 | 50.53 | 6.83 | 271872 | 271872 | 8.37e-03 | 9.08 | 2.15 | 0.94 |
| Dennbach | 0.0 | 0.08 | 0.91 | 0.01 | 0.01 | 1.68 | 4.1 | 6.30 | 50.48 | 6.99 | 50.42 | 6.97 | 2718748 | 2718748 | 1.75e-02 | 9.95 | 2.38 | 1.41 |
| Wirftbach | 0.1 | 0.31 | 0.54 | 0.04 | 0.02 | 1.49 | 2.3 | 22.00 | 50.37 | 6.84 | 50.34 | 6.93 | 271899 | 271899 | 4.81e-03 | 7.69 | 1.25 | 0.84 |
| Ansbach | 0.05 | 0.24 | 0.68 | 0.02 | 0.01 | 1.37 | 2.5 | 22.00 | 50.43 | 6.85 | 50.44 | 6.75 | 271854 | 271854 | 1.29e-02 | 9.03 | 1.63 | 1.19 |
| Vischelbach | 0.05 | 0.27 | 0.62 | 0.01 | 0.01 | 1.45 | 1.66 | 1.00 | 50.51 | 6.98 | 50.57 | 6.94 | 271892 | 271892 | 4.75e-03 | 7.21 | 1.26 | 0.87 |
<AxesSubplot:xlabel='Bach'>
We make also a merger with a surface area dataframe. Note that the "Max_Q" is no longer correct due to picking some other rainfall sets.
| agriculture | grassland | forest | build | bare_soils | slope | slope_2 | Bach_x | Distance | Lati | Long | Latitude | Longitude | Streamcode | Bach_y | Area | Max_Q | Bache | |
|---|---|---|---|---|---|---|---|---|---|---|---|---|---|---|---|---|---|---|
| 0 | 0.14 | 0.32 | 0.51 | 0.02 | 0.01 | 1.08 | 1.71 | Armuthsbach | 18.80 | 50.45 | 6.87 | 50.47 | 6.71 | 271856 | Armuths | 72.60 | 139.48 | Armuthsbach |
| 1 | 0.09 | 0.26 | 0.61 | 0.03 | 0.01 | 1.06 | 1.5 | Sahrbach | 2.17 | 50.51 | 6.97 | 50.54 | 6.85 | 27188 | Sahr | 45.60 | 86.19 | Sahrbach |
| 2 | 0.11 | 0.36 | 0.47 | 0.04 | 0.01 | 0.84 | 1.03 | Trierbach | 34.00 | 50.36 | 6.83 | 50.30 | 6.91 | 27184 | Trier | 55.06 | 84.78 | Trierbach |
| 3 | 0.02 | 0.22 | 0.72 | 0.04 | 0.0 | 1.7 | 1.79 | Adenauerbach | 11.20 | 50.44 | 6.93 | 50.35 | 6.97 | 27186 | Adenauer | 58.45 | 108.72 | Adenauerbach |
| 4 | 0.03 | 0.26 | 0.7 | 0.01 | 0.01 | 1.67 | 2.99 | Staffelbach | 10.20 | 50.48 | 7.03 | 50.46 | 7.11 | 271874 | Staffel | 38.00 | 38.12 | Staffelbach |
| 5 | 0.0 | 0.18 | 0.8 | 0.01 | 0.01 | 2.33 | 2.43 | Weidenbach | 8.30 | 50.48 | 7.02 | 50.39 | 7.03 | 2718741 | Weiden | 37.90 | 77.85 | Weidenbach |
| 6 | 0.15 | 0.32 | 0.49 | 0.02 | 0.02 | 0.96 | 1.56 | Nohnerbach | 35.50 | 50.36 | 6.83 | 50.28 | 6.88 | 271812 | Nohner | 31.26 | 57.05 | Nohnerbach |
| 7 | 0.04 | 0.2 | 0.74 | 0.01 | 0.01 | 2.3 | 1.99 | Liersbach | 10.00 | 50.46 | 6.94 | 50.53 | 6.83 | 271872 | Liers | 28.94 | 77.87 | Liersbach |
| 8 | 0.0 | 0.08 | 0.91 | 0.01 | 0.01 | 1.68 | 4.1 | Dennbach | 6.30 | 50.48 | 6.99 | 50.42 | 6.97 | 2718748 | Denn | 20.00 | 46.28 | Dennbach |
| 9 | 0.1 | 0.31 | 0.54 | 0.04 | 0.02 | 1.49 | 2.3 | Wirftbach | 22.00 | 50.37 | 6.84 | 50.34 | 6.93 | 271899 | Wirft | 25.20 | 41.57 | Wirftbach |
| 10 | 0.05 | 0.24 | 0.68 | 0.02 | 0.01 | 1.37 | 2.5 | Ansbach | 22.00 | 50.43 | 6.85 | 50.44 | 6.75 | 271854 | Ans | 15.00 | 41.13 | Ansbach |
| 11 | 0.05 | 0.27 | 0.62 | 0.01 | 0.01 | 1.45 | 1.66 | Vischelbach | 1.00 | 50.51 | 6.98 | 50.57 | 6.94 | 271892 | Vischel | 20.70 | 40.00 | Vischelbach |
The outflow for only 1 day was not so important as a feature, as it turned out...
| agriculture | grassland | forest | build | bare_soils | slope | slope_2 | Bach_x | Distance | Lati | Long | Latitude | Longitude | Streamcode | Bach_y | Area | Max_Q | Bache | SUM1407 | |
|---|---|---|---|---|---|---|---|---|---|---|---|---|---|---|---|---|---|---|---|
| 0 | 0.14 | 0.32 | 0.51 | 0.02 | 0.01 | 1.08 | 1.71 | Armuthsbach | 18.80 | 50.45 | 6.87 | 50.47 | 6.71 | 271856 | Armuths | 72.60 | 139.48 | Armuthsbach | 140.85 |
| 1 | 0.09 | 0.26 | 0.61 | 0.03 | 0.01 | 1.06 | 1.5 | Sahrbach | 2.17 | 50.51 | 6.97 | 50.54 | 6.85 | 27188 | Sahr | 45.60 | 86.19 | Sahrbach | 140.85 |
| 2 | 0.11 | 0.36 | 0.47 | 0.04 | 0.01 | 0.84 | 1.03 | Trierbach | 34.00 | 50.36 | 6.83 | 50.30 | 6.91 | 27184 | Trier | 55.06 | 84.78 | Trierbach | 80.00 |
| 3 | 0.02 | 0.22 | 0.72 | 0.04 | 0.0 | 1.7 | 1.79 | Adenauerbach | 11.20 | 50.44 | 6.93 | 50.35 | 6.97 | 27186 | Adenauer | 58.45 | 108.72 | Adenauerbach | 80.00 |
| 4 | 0.03 | 0.26 | 0.7 | 0.01 | 0.01 | 1.67 | 2.99 | Staffelbach | 10.20 | 50.48 | 7.03 | 50.46 | 7.11 | 271874 | Staffel | 38.00 | 38.12 | Staffelbach | 79.00 |
| 5 | 0.0 | 0.18 | 0.8 | 0.01 | 0.01 | 2.33 | 2.43 | Weidenbach | 8.30 | 50.48 | 7.02 | 50.39 | 7.03 | 2718741 | Weiden | 37.90 | 77.85 | Weidenbach | 79.23 |
| 6 | 0.15 | 0.32 | 0.49 | 0.02 | 0.02 | 0.96 | 1.56 | Nohnerbach | 35.50 | 50.36 | 6.83 | 50.28 | 6.88 | 271812 | Nohner | 31.26 | 57.05 | Nohnerbach | 102.60 |
| 7 | 0.04 | 0.2 | 0.74 | 0.01 | 0.01 | 2.3 | 1.99 | Liersbach | 10.00 | 50.46 | 6.94 | 50.53 | 6.83 | 271872 | Liers | 28.94 | 77.87 | Liersbach | 115.45 |
| 8 | 0.0 | 0.08 | 0.91 | 0.01 | 0.01 | 1.68 | 4.1 | Dennbach | 6.30 | 50.48 | 6.99 | 50.42 | 6.97 | 2718748 | Denn | 20.00 | 46.28 | Dennbach | 99.99 |
| 9 | 0.1 | 0.31 | 0.54 | 0.04 | 0.02 | 1.49 | 2.3 | Wirftbach | 22.00 | 50.37 | 6.84 | 50.34 | 6.93 | 271899 | Wirft | 25.20 | 41.57 | Wirftbach | 80.00 |
| 10 | 0.05 | 0.24 | 0.68 | 0.02 | 0.01 | 1.37 | 2.5 | Ansbach | 22.00 | 50.43 | 6.85 | 50.44 | 6.75 | 271854 | Ans | 15.00 | 41.13 | Ansbach | 115.45 |
| 11 | 0.05 | 0.27 | 0.62 | 0.01 | 0.01 | 1.45 | 1.66 | Vischelbach | 1.00 | 50.51 | 6.98 | 50.57 | 6.94 | 271892 | Vischel | 20.70 | 40.00 | Vischelbach | 131.00 |
<class 'pandas.core.frame.DataFrame'>
Int64Index: 12 entries, 0 to 11
Data columns (total 20 columns):
 #   Column       Non-Null Count  Dtype
---  ------       --------------  -----
 0   agriculture  12 non-null     object
 1   grassland    12 non-null     object
 2   forest       12 non-null     object
 3   build        12 non-null     object
 4   bare_soils   12 non-null     object
 5   slope        12 non-null     object
 6   slope_2      12 non-null     object
 7   Bach_x       12 non-null     object
 8   Distance     12 non-null     float64
 9   Lati         12 non-null     float64
 10  Long         12 non-null     float64
 11  Latitude     12 non-null     float64
 12  Longitude    12 non-null     float64
 13  Streamcode   12 non-null     int32
 14  Bach_y       12 non-null     object
 15  Area         12 non-null     float64
 16  Max_Q        12 non-null     float64
 17  Bache        12 non-null     object
 18  SUM1407      12 non-null     float64
 19  Q_area       12 non-null     float64
dtypes: float64(9), int32(1), object(10)
memory usage: 1.9+ KB
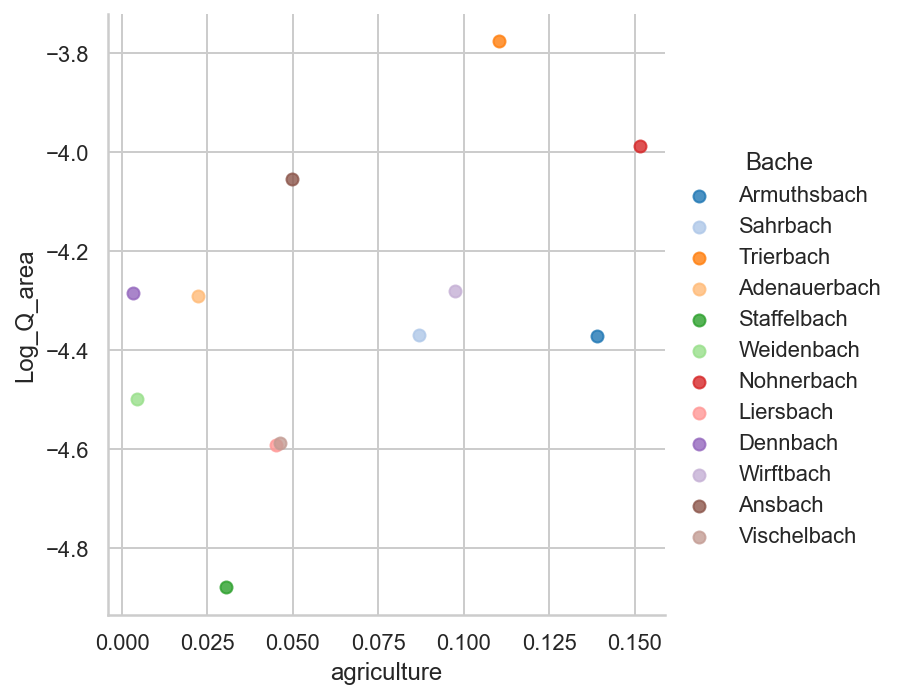
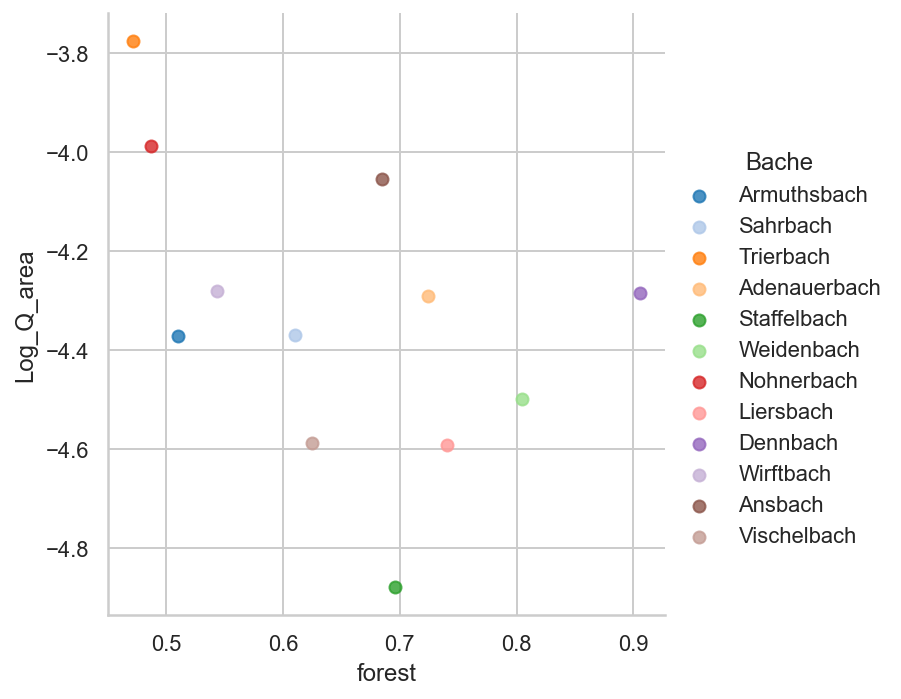
1.0.6.2 Regression plots of land area and maximum outflow.
Note that these plots are only illustrative. For a better correlation rainfall-runoff we should add at least the soil texture, and land cover type. Also rainfall intensity, the saturation of upper soil horizon and the depth of subsoil saturation play a role.

Strange this positive relation of forests to higher outflows, but could it be that most forest are standing on steeper grounds than pastures or arable land?
Strange this positive relation of forests to higher outflows, but could it be that most forest are standing on steeper grounds than pastures or arable land
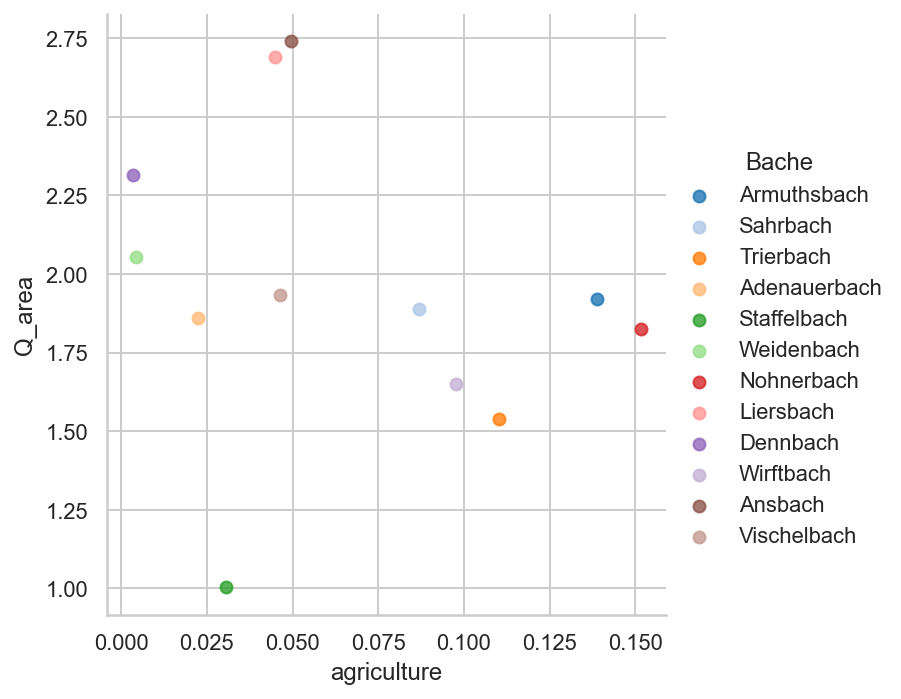
Staffelbach rainfall dataset was that of Neuenahr, which had lower volumes. Conversely, the Freilingen dataset was chosen for Ans- and Trierbach.
sns.lmplot( x='agriculture',y='Q_area', data=df_cd2);

Here the slope was entered in the calculation.
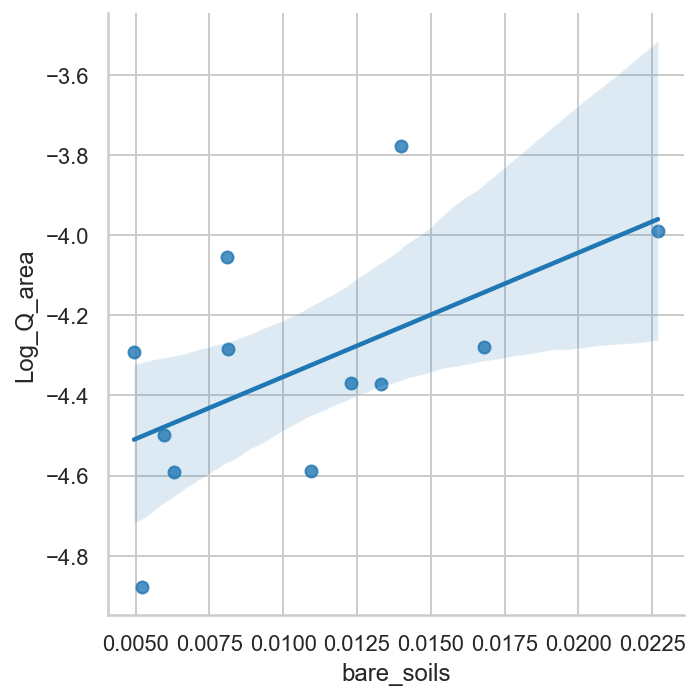
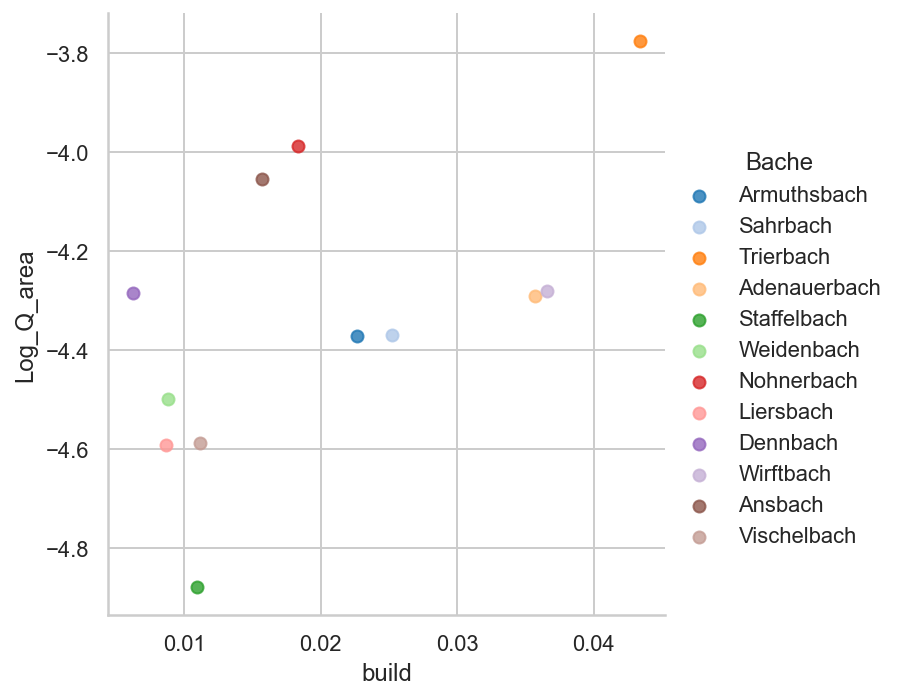
Buildings tend to be build on smoother surface area's for better stability.
sns.lmplot( x='build',y="Q_area", data=df_cd2, palette='tab20', ); # hue='Log_Q_area' ,legend='Bache',
1.0.7 ESA worldcover 2020 data
| Unnamed: 0 | agriculture | grassland | forest | build | bare_soils | slope | sqrt_s | Distance | Lati | Long | Latitude | Longitude | Streamcode | Bach_y | Area | Max_Q | Bache | SUM1407 | Q_area | Log_Q_area | |
|---|---|---|---|---|---|---|---|---|---|---|---|---|---|---|---|---|---|---|---|---|---|
| Bach_x | |||||||||||||||||||||
| Armuthsbach | 0 | 1.39e-01 | 0.32 | 0.51 | 2.27e-02 | 1.33e-02 | 1.71 | 1.31 | 18.80 | 50.45 | 6.87 | 50.47 | 6.71 | 271856 | Armuths | 72.60 | 139.48 | Armuthsbach | 140.85 | 1.92 | -4.37 |
| Sahrbach | 1 | 8.68e-02 | 0.26 | 0.61 | 2.52e-02 | 1.23e-02 | 1.50 | 1.22 | 2.17 | 50.51 | 6.97 | 50.54 | 6.85 | 27188 | Sahr | 45.60 | 86.19 | Sahrbach | 140.85 | 1.89 | -4.37 |
| Trierbach | 2 | 1.10e-01 | 0.36 | 0.47 | 4.34e-02 | 1.40e-02 | 1.03 | 1.01 | 34.00 | 50.36 | 6.83 | 50.30 | 6.91 | 27184 | Trier | 55.06 | 84.78 | Trierbach | 80.00 | 1.54 | -3.78 |
| Adenauerbach | 3 | 2.23e-02 | 0.22 | 0.72 | 3.57e-02 | 4.95e-03 | 1.79 | 1.34 | 11.20 | 50.44 | 6.93 | 50.35 | 6.97 | 27186 | Adenauer | 58.45 | 108.72 | Adenauerbach | 80.00 | 1.86 | -4.29 |
| Staffelbach | 4 | 3.05e-02 | 0.26 | 0.70 | 1.09e-02 | 5.21e-03 | 2.99 | 1.73 | 10.20 | 50.48 | 7.03 | 50.46 | 7.11 | 271874 | Staffel | 38.00 | 38.12 | Staffelbach | 79.00 | 1.00 | -4.88 |
| Weidenbach | 5 | 4.28e-03 | 0.18 | 0.80 | 8.79e-03 | 5.95e-03 | 2.43 | 1.56 | 8.30 | 50.48 | 7.02 | 50.39 | 7.03 | 2718741 | Weiden | 37.90 | 77.85 | Weidenbach | 79.23 | 2.05 | -4.50 |
| Nohnerbach | 6 | 1.52e-01 | 0.32 | 0.49 | 1.83e-02 | 2.27e-02 | 1.56 | 1.25 | 35.50 | 50.36 | 6.83 | 50.28 | 6.88 | 271812 | Nohner | 31.26 | 57.05 | Nohnerbach | 102.60 | 1.82 | -3.99 |
| Liersbach | 7 | 4.49e-02 | 0.20 | 0.74 | 8.65e-03 | 6.30e-03 | 2.00 | 1.41 | 10.00 | 50.46 | 6.94 | 50.53 | 6.83 | 271872 | Liers | 28.94 | 77.87 | Liersbach | 115.45 | 2.69 | -4.59 |
| Dennbach | 8 | 3.30e-03 | 0.08 | 0.91 | 6.26e-03 | 8.11e-03 | 4.10 | 2.02 | 6.30 | 50.48 | 6.99 | 50.42 | 6.97 | 2718748 | Denn | 20.00 | 46.28 | Dennbach | 99.99 | 2.31 | -4.28 |
| Wirftbach | 9 | 9.76e-02 | 0.31 | 0.54 | 3.65e-02 | 1.68e-02 | 2.30 | 1.52 | 22.00 | 50.37 | 6.84 | 50.34 | 6.93 | 271899 | Wirft | 25.20 | 41.57 | Wirftbach | 80.00 | 1.65 | -4.28 |
| Ansbach | 10 | 4.97e-02 | 0.24 | 0.68 | 1.57e-02 | 8.11e-03 | 2.50 | 1.58 | 22.00 | 50.43 | 6.85 | 50.44 | 6.75 | 271854 | Ans | 15.00 | 41.13 | Ansbach | 115.45 | 2.74 | -4.05 |
| Vischelbach | 11 | 4.64e-02 | 0.27 | 0.62 | 1.11e-02 | 1.09e-02 | 1.66 | 1.29 | 1.00 | 50.51 | 6.98 | 50.57 | 6.94 | 271892 | Vischel | 20.70 | 40.00 | Vischelbach | 131.00 | 1.93 | -4.59 |
| Upper Ahr | 12 | 1.36e-01 | 0.40 | 0.41 | 2.85e-02 | 2.12e-02 | 1.08 | 1.04 | 35.00 | 50.37 | 6.80 | 50.43 | 6.66 | 27181 | UpperAhr | 252.34 | 382.54 | Upper Ahr | 108.00 | 2.03 | -4.59 |
| wkt_geom | Treecover | Grassland | Cropland | Built-up | Bare_spars | Waterbody | LULC_TOTAL | |
|---|---|---|---|---|---|---|---|---|
| Name | ||||||||
| Adenauerbach | MultiPolygon (((4103890.61303603276610374 3029... | 0.84 | 0.14 | 4.89e-03 | 1.76e-02 | 1.54e-03 | 1.00e-06 | 1167920 |
| Ansbach | MultiPolygon (((4090406.74759881710633636 3042... | 0.74 | 0.24 | 1.36e-02 | 6.92e-03 | 8.61e-04 | 0.00e+00 | 301917 |
| Armuthsbach | MultiPolygon (((4086674.71472339006140828 3044... | 0.57 | 0.38 | 3.90e-02 | 9.93e-03 | 1.28e-03 | 0.00e+00 | 1493201 |
| Dennbach | MultiPolygon (((4105954.62636257708072662 3038... | 0.96 | 0.03 | 1.07e-04 | 2.75e-03 | 6.60e-04 | 0.00e+00 | 392272 |
| Liersbach | MultiPolygon (((4098323.02225150354206562 3050... | 0.80 | 0.19 | 5.11e-03 | 2.03e-03 | 2.54e-04 | 0.00e+00 | 539988 |
| Nohnerbach | MultiPolygon (((4092905.83836966659873724 3032... | 0.56 | 0.33 | 9.53e-02 | 8.65e-03 | 1.07e-03 | 9.00e-06 | 652011 |
| Sahrbach | MultiPolygon (((4100654.05724611924961209 3048... | 0.66 | 0.32 | 1.18e-02 | 1.22e-02 | 1.28e-03 | 2.00e-06 | 945593 |
| Staffelbach | MultiPolygon (((4110741.36151165282353759 3042... | 0.77 | 0.22 | 1.03e-02 | 4.03e-03 | 1.12e-03 | 1.00e-06 | 758791 |
| Trierbach | MultiPolygon (((4095046.19109569722786546 3031... | 0.56 | 0.32 | 9.13e-02 | 2.52e-02 | 2.14e-03 | 0.00e+00 | 1136419 |
| Upper Ahr | MultiPolygon (((4096023.07086387882009149 3022... | 0.48 | 0.39 | 1.07e-01 | 1.70e-02 | 4.19e-03 | 7.59e-04 | 5178833 |
| Vischelbach | MultiPolygon (((4104826.14673754805698991 3050... | 0.70 | 0.28 | 9.06e-03 | 8.62e-03 | 1.51e-03 | 0.00e+00 | 386803 |
| Weidenbach | MultiPolygon (((4108346.57140650320798159 3034... | 0.88 | 0.12 | 1.48e-03 | 3.20e-03 | 5.35e-04 | 0.00e+00 | 763915 |
| Wirftbach | MultiPolygon (((4101582.24368390860036016 3029... | 0.61 | 0.32 | 4.55e-02 | 2.42e-02 | 1.16e-03 | 1.37e-04 | 511305 |
| wkt_geom | Treecover | Grassland | Cropland | Built-up | Bare_spars | Waterbody | LULC_TOTAL | Unnamed: 0 | agriculture | grassland | forest | build | bare_soils | slope | sqrt_s | Distance | Lati | Long | Latitude | Longitude | Streamcode | Bach_y | Area | Max_Q | Bache | SUM1407 | Q_area | Log_Q_area | |
|---|---|---|---|---|---|---|---|---|---|---|---|---|---|---|---|---|---|---|---|---|---|---|---|---|---|---|---|---|---|
| Adenauerbach | MultiPolygon (((4103890.61303603276610374 3029... | 0.84 | 0.14 | 4.89e-03 | 1.76e-02 | 1.54e-03 | 1.00e-06 | 1167920 | 3 | 2.23e-02 | 0.22 | 0.72 | 3.57e-02 | 4.95e-03 | 1.79 | 1.34 | 11.20 | 50.44 | 6.93 | 50.35 | 6.97 | 27186 | Adenauer | 58.45 | 108.72 | Adenauerbach | 80.00 | 1.86 | -4.29 |
| Ansbach | MultiPolygon (((4090406.74759881710633636 3042... | 0.74 | 0.24 | 1.36e-02 | 6.92e-03 | 8.61e-04 | 0.00e+00 | 301917 | 10 | 4.97e-02 | 0.24 | 0.68 | 1.57e-02 | 8.11e-03 | 2.50 | 1.58 | 22.00 | 50.43 | 6.85 | 50.44 | 6.75 | 271854 | Ans | 15.00 | 41.13 | Ansbach | 115.45 | 2.74 | -4.05 |
| Armuthsbach | MultiPolygon (((4086674.71472339006140828 3044... | 0.57 | 0.38 | 3.90e-02 | 9.93e-03 | 1.28e-03 | 0.00e+00 | 1493201 | 0 | 1.39e-01 | 0.32 | 0.51 | 2.27e-02 | 1.33e-02 | 1.71 | 1.31 | 18.80 | 50.45 | 6.87 | 50.47 | 6.71 | 271856 | Armuths | 72.60 | 139.48 | Armuthsbach | 140.85 | 1.92 | -4.37 |
| Dennbach | MultiPolygon (((4105954.62636257708072662 3038... | 0.96 | 0.03 | 1.07e-04 | 2.75e-03 | 6.60e-04 | 0.00e+00 | 392272 | 8 | 3.30e-03 | 0.08 | 0.91 | 6.26e-03 | 8.11e-03 | 4.10 | 2.02 | 6.30 | 50.48 | 6.99 | 50.42 | 6.97 | 2718748 | Denn | 20.00 | 46.28 | Dennbach | 99.99 | 2.31 | -4.28 |
| Liersbach | MultiPolygon (((4098323.02225150354206562 3050... | 0.80 | 0.19 | 5.11e-03 | 2.03e-03 | 2.54e-04 | 0.00e+00 | 539988 | 7 | 4.49e-02 | 0.20 | 0.74 | 8.65e-03 | 6.30e-03 | 2.00 | 1.41 | 10.00 | 50.46 | 6.94 | 50.53 | 6.83 | 271872 | Liers | 28.94 | 77.87 | Liersbach | 115.45 | 2.69 | -4.59 |
| Nohnerbach | MultiPolygon (((4092905.83836966659873724 3032... | 0.56 | 0.33 | 9.53e-02 | 8.65e-03 | 1.07e-03 | 9.00e-06 | 652011 | 6 | 1.52e-01 | 0.32 | 0.49 | 1.83e-02 | 2.27e-02 | 1.56 | 1.25 | 35.50 | 50.36 | 6.83 | 50.28 | 6.88 | 271812 | Nohner | 31.26 | 57.05 | Nohnerbach | 102.60 | 1.82 | -3.99 |
| Sahrbach | MultiPolygon (((4100654.05724611924961209 3048... | 0.66 | 0.32 | 1.18e-02 | 1.22e-02 | 1.28e-03 | 2.00e-06 | 945593 | 1 | 8.68e-02 | 0.26 | 0.61 | 2.52e-02 | 1.23e-02 | 1.50 | 1.22 | 2.17 | 50.51 | 6.97 | 50.54 | 6.85 | 27188 | Sahr | 45.60 | 86.19 | Sahrbach | 140.85 | 1.89 | -4.37 |
| Staffelbach | MultiPolygon (((4110741.36151165282353759 3042... | 0.77 | 0.22 | 1.03e-02 | 4.03e-03 | 1.12e-03 | 1.00e-06 | 758791 | 4 | 3.05e-02 | 0.26 | 0.70 | 1.09e-02 | 5.21e-03 | 2.99 | 1.73 | 10.20 | 50.48 | 7.03 | 50.46 | 7.11 | 271874 | Staffel | 38.00 | 38.12 | Staffelbach | 79.00 | 1.00 | -4.88 |
| Trierbach | MultiPolygon (((4095046.19109569722786546 3031... | 0.56 | 0.32 | 9.13e-02 | 2.52e-02 | 2.14e-03 | 0.00e+00 | 1136419 | 2 | 1.10e-01 | 0.36 | 0.47 | 4.34e-02 | 1.40e-02 | 1.03 | 1.01 | 34.00 | 50.36 | 6.83 | 50.30 | 6.91 | 27184 | Trier | 55.06 | 84.78 | Trierbach | 80.00 | 1.54 | -3.78 |
| Upper Ahr | MultiPolygon (((4096023.07086387882009149 3022... | 0.48 | 0.39 | 1.07e-01 | 1.70e-02 | 4.19e-03 | 7.59e-04 | 5178833 | 12 | 1.36e-01 | 0.40 | 0.41 | 2.85e-02 | 2.12e-02 | 1.08 | 1.04 | 35.00 | 50.37 | 6.80 | 50.43 | 6.66 | 27181 | UpperAhr | 252.34 | 382.54 | Upper Ahr | 108.00 | 2.03 | -4.59 |
| Vischelbach | MultiPolygon (((4104826.14673754805698991 3050... | 0.70 | 0.28 | 9.06e-03 | 8.62e-03 | 1.51e-03 | 0.00e+00 | 386803 | 11 | 4.64e-02 | 0.27 | 0.62 | 1.11e-02 | 1.09e-02 | 1.66 | 1.29 | 1.00 | 50.51 | 6.98 | 50.57 | 6.94 | 271892 | Vischel | 20.70 | 40.00 | Vischelbach | 131.00 | 1.93 | -4.59 |
| Weidenbach | MultiPolygon (((4108346.57140650320798159 3034... | 0.88 | 0.12 | 1.48e-03 | 3.20e-03 | 5.35e-04 | 0.00e+00 | 763915 | 5 | 4.28e-03 | 0.18 | 0.80 | 8.79e-03 | 5.95e-03 | 2.43 | 1.56 | 8.30 | 50.48 | 7.02 | 50.39 | 7.03 | 2718741 | Weiden | 37.90 | 77.85 | Weidenbach | 79.23 | 2.05 | -4.50 |
| Wirftbach | MultiPolygon (((4101582.24368390860036016 3029... | 0.61 | 0.32 | 4.55e-02 | 2.42e-02 | 1.16e-03 | 1.37e-04 | 511305 | 9 | 9.76e-02 | 0.31 | 0.54 | 3.65e-02 | 1.68e-02 | 2.30 | 1.52 | 22.00 | 50.37 | 6.84 | 50.34 | 6.93 | 271899 | Wirft | 25.20 | 41.57 | Wirftbach | 80.00 | 1.65 | -4.28 |
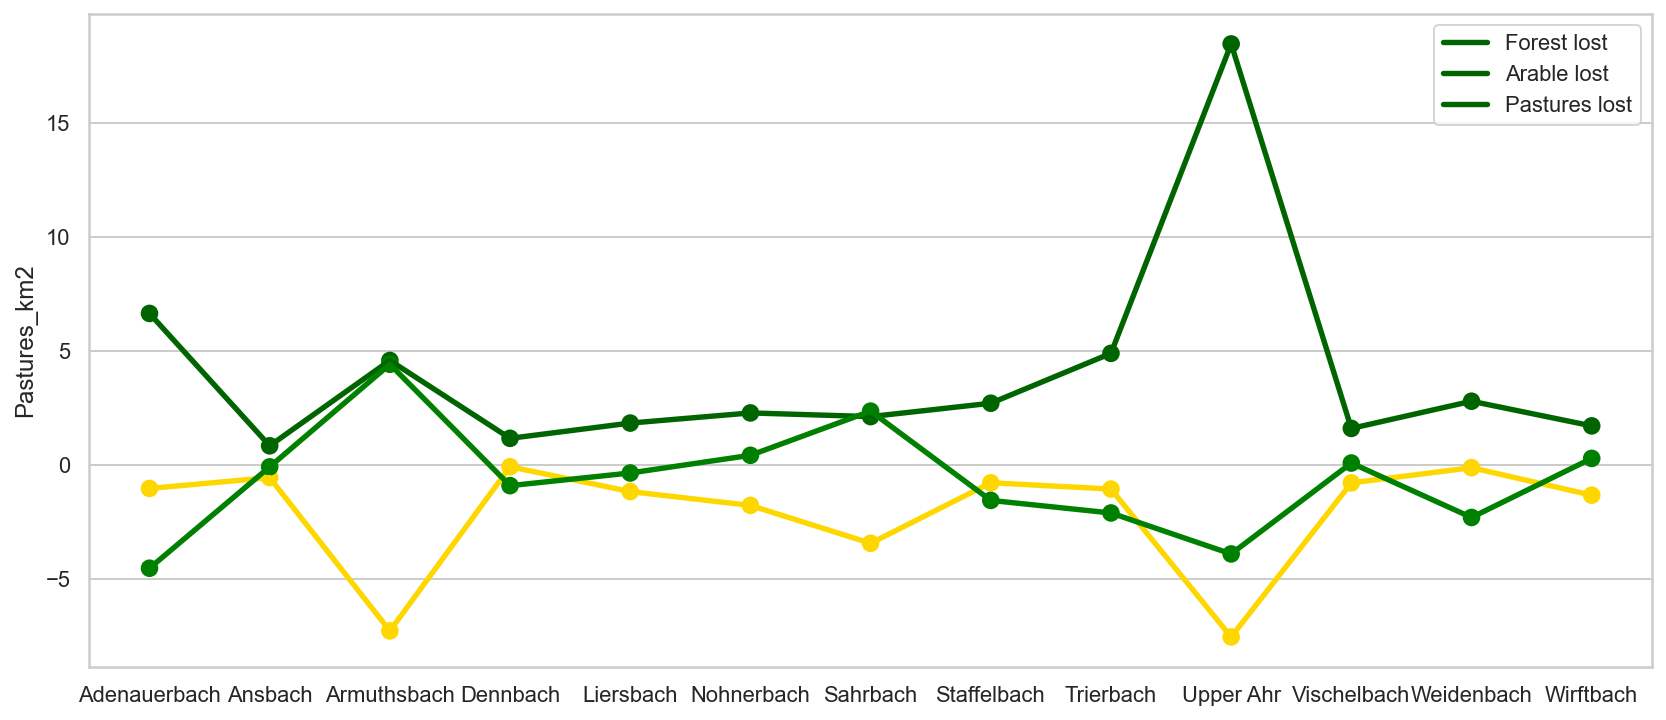
1.0.8 Comparison of Land use proportions from ...
the Land use classification map Germany 2019 and the ESA WorldCover 10m 2020 map.
The Land use classification map Germany 2019 is based on a map and
data collected spanning the whole year 2019. In addition, this new map
has been updated recently.
The ESA WorldCover 10m 2020 map bears in its title "2020", however it
hasn't had recent updates, and it also contains data from an older
timerange: 2018 until 2019.
It turns out that tree cover is not the same as forested land. When you zoom in you can see that there are small spots of tree cover within builded areas. This is not real forest, it is tree cover of only one or a few trees.
| Forest | Pastures | Arable | Buildings | Bare_sparse | |
|---|---|---|---|---|---|
| Adenauerbach | 0.11 | -7.72e-02 | -1.74e-02 | -1.81e-02 | -3.41e-03 |
| Ansbach | 0.06 | -4.63e-03 | -3.60e-02 | -8.75e-03 | -7.25e-03 |
| Armuthsbach | 0.06 | 6.10e-02 | -1.00e-01 | -1.27e-02 | -1.20e-02 |
| Dennbach | 0.06 | -4.46e-02 | -3.20e-03 | -3.51e-03 | -7.45e-03 |
| Liersbach | 0.06 | -1.17e-02 | -3.98e-02 | -6.62e-03 | -6.05e-03 |
| Nohnerbach | 0.07 | 1.40e-02 | -5.63e-02 | -9.69e-03 | -2.16e-02 |
| Sahrbach | 0.05 | 5.20e-02 | -7.50e-02 | -1.30e-02 | -1.10e-02 |
| Staffelbach | 0.07 | -4.05e-02 | -2.02e-02 | -6.91e-03 | -4.09e-03 |
| Trierbach | 0.09 | -3.80e-02 | -1.89e-02 | -1.82e-02 | -1.19e-02 |
| Upper Ahr | 0.07 | -1.54e-02 | -2.98e-02 | -1.15e-02 | -1.70e-02 |
| Vischelbach | 0.08 | 4.75e-03 | -3.73e-02 | -2.50e-03 | -9.42e-03 |
| Weidenbach | 0.07 | -6.03e-02 | -2.80e-03 | -5.59e-03 | -5.42e-03 |
| Wirftbach | 0.07 | 1.20e-02 | -5.21e-02 | -1.23e-02 | -1.56e-02 |
So, over the course of 1-1.5 year, 11 % of the forest of the Adenauerbach region has disappeared.
This is a cut rate that is not sustainable in terms of longterm forest management with tree species like oak and beech.
There might have been done some forced or illegal tree fellings.
Infestations of trees with the European spruce beetle fall under forced fellings.
Keep in mind that any "beetle wood" that was not sold due to poor price offerings, will most of times not appear in the official wood cuttings or wood sales data!
| Forest | Pastures | Arable | Buildings | Bare_sparse | |
|---|---|---|---|---|---|
| Adenauerbach | 0.16 | -0.36 | -0.78 | -0.51 | -0.69 |
| Ansbach | 0.08 | -0.02 | -0.73 | -0.56 | -0.89 |
| Armuthsbach | 0.12 | 0.19 | -0.72 | -0.56 | -0.90 |
| Dennbach | 0.07 | -0.58 | -0.97 | -0.56 | -0.92 |
| Liersbach | 0.09 | -0.06 | -0.89 | -0.77 | -0.96 |
| Nohnerbach | 0.15 | 0.04 | -0.37 | -0.53 | -0.95 |
| Sahrbach | 0.08 | 0.20 | -0.86 | -0.51 | -0.90 |
| Staffelbach | 0.10 | -0.16 | -0.66 | -0.63 | -0.79 |
| Trierbach | 0.19 | -0.11 | -0.17 | -0.42 | -0.85 |
| Upper Ahr | 0.18 | -0.04 | -0.22 | -0.40 | -0.80 |
| Vischelbach | 0.12 | 0.02 | -0.80 | -0.22 | -0.86 |
| Weidenbach | 0.09 | -0.34 | -0.65 | -0.64 | -0.91 |
| Wirftbach | 0.13 | 0.04 | -0.53 | -0.34 | -0.93 |
| Forest | Pastures | Arable | Buildings | Bare_sparse | |
|---|---|---|---|---|---|
| Adenauerbach | 15.71 | -35.87 | -78.02 | -50.70 | -68.88 |
| Ansbach | 8.31 | -1.92 | -72.59 | -55.84 | -89.38 |
| Armuthsbach | 12.41 | 19.36 | -71.93 | -56.21 | -90.39 |
| Dennbach | 6.52 | -58.24 | -96.76 | -56.13 | -91.87 |
| Liersbach | 8.63 | -5.85 | -88.63 | -76.54 | -95.97 |
| Nohnerbach | 15.06 | 4.37 | -37.13 | -52.83 | -95.29 |
| Sahrbach | 7.66 | 19.64 | -86.35 | -51.49 | -89.56 |
| Staffelbach | 10.28 | -15.73 | -66.10 | -63.14 | -78.51 |
| Trierbach | 18.88 | -10.61 | -17.17 | -41.96 | -84.74 |
| Upper Ahr | 17.90 | -3.81 | -21.85 | -40.47 | -80.19 |
| Vischelbach | 12.49 | 1.74 | -80.46 | -22.49 | -86.16 |
| Weidenbach | 9.20 | -34.22 | -65.37 | -63.56 | -91.01 |
| Wirftbach | 12.60 | 3.92 | -53.35 | -33.73 | -93.10 |
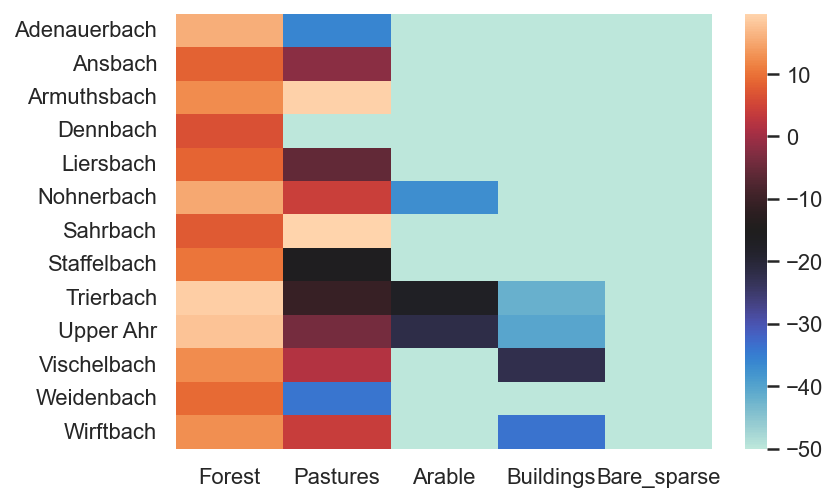
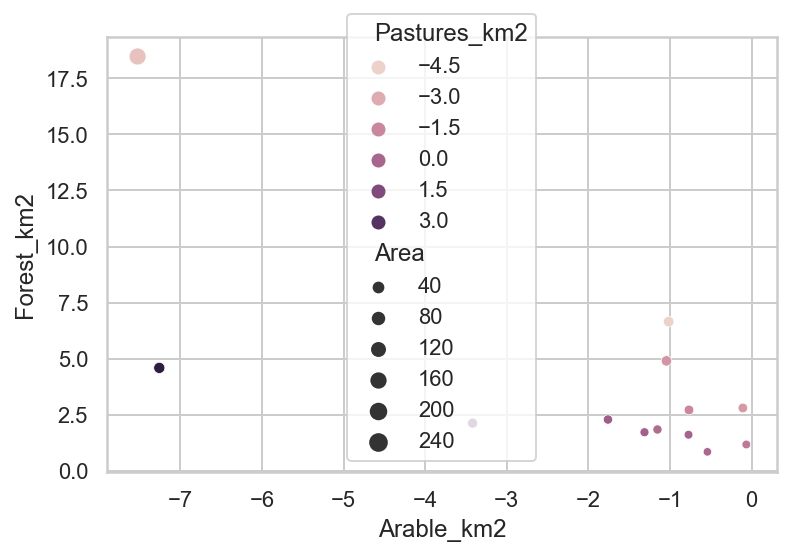
The difference in land use surface area claimed by the "newer" 2020 map.
| Forest | Pastures | Arable | Buildings | Bare_sparse | Area | Forest_km2 | Pastures_km2 | Arable_km2 | Buildings_km2 | Bare_sparse_km2 | |
|---|---|---|---|---|---|---|---|---|---|---|---|
| Adenauerbach | 0.16 | -0.36 | -0.78 | -0.51 | -0.69 | 58.45 | 6.65 | -4.51 | -1.02 | -1.06 | -0.20 |
| Ansbach | 0.08 | -0.02 | -0.73 | -0.56 | -0.89 | 15.00 | 0.85 | -0.07 | -0.54 | -0.13 | -0.11 |
| Armuthsbach | 0.12 | 0.19 | -0.72 | -0.56 | -0.90 | 72.60 | 4.59 | 4.43 | -7.26 | -0.93 | -0.87 |
| Dennbach | 0.07 | -0.58 | -0.97 | -0.56 | -0.92 | 20.00 | 1.18 | -0.89 | -0.06 | -0.07 | -0.15 |
| Liersbach | 0.09 | -0.06 | -0.89 | -0.77 | -0.96 | 28.94 | 1.85 | -0.34 | -1.15 | -0.19 | -0.18 |
| Nohnerbach | 0.15 | 0.04 | -0.37 | -0.53 | -0.95 | 31.26 | 2.29 | 0.44 | -1.76 | -0.30 | -0.68 |
| Sahrbach | 0.08 | 0.20 | -0.86 | -0.51 | -0.90 | 45.60 | 2.13 | 2.37 | -3.42 | -0.59 | -0.50 |
| Staffelbach | 0.10 | -0.16 | -0.66 | -0.63 | -0.79 | 38.00 | 2.72 | -1.54 | -0.77 | -0.26 | -0.16 |
| Trierbach | 0.19 | -0.11 | -0.17 | -0.42 | -0.85 | 55.06 | 4.91 | -2.09 | -1.04 | -1.00 | -0.65 |
| Upper Ahr | 0.18 | -0.04 | -0.22 | -0.40 | -0.80 | 252.34 | 18.46 | -3.88 | -7.52 | -2.91 | -4.28 |
| Vischelbach | 0.12 | 0.02 | -0.80 | -0.22 | -0.86 | 20.70 | 1.62 | 0.10 | -0.77 | -0.05 | -0.19 |
| Weidenbach | 0.09 | -0.34 | -0.65 | -0.64 | -0.91 | 37.90 | 2.81 | -2.29 | -0.11 | -0.21 | -0.21 |
| Wirftbach | 0.13 | 0.04 | -0.53 | -0.34 | -0.93 | 25.20 | 1.73 | 0.30 | -1.31 | -0.31 | -0.39 |
| Forest_km2 | Pastures_km2 | Arable_km2 | Buildings_km2 | Bare_sparse_km2 | |
|---|---|---|---|---|---|
| Adenauerbach | 6.65 | -4.51 | -1.02 | -1.06 | -0.20 |
| Ansbach | 0.85 | -0.07 | -0.54 | -0.13 | -0.11 |
| Armuthsbach | 4.59 | 4.43 | -7.26 | -0.93 | -0.87 |
| Dennbach | 1.18 | -0.89 | -0.06 | -0.07 | -0.15 |
| Liersbach | 1.85 | -0.34 | -1.15 | -0.19 | -0.18 |
| Nohnerbach | 2.29 | 0.44 | -1.76 | -0.30 | -0.68 |
| Sahrbach | 2.13 | 2.37 | -3.42 | -0.59 | -0.50 |
| Staffelbach | 2.72 | -1.54 | -0.77 | -0.26 | -0.16 |
| Trierbach | 4.91 | -2.09 | -1.04 | -1.00 | -0.65 |
| Upper Ahr | 18.46 | -3.88 | -7.52 | -2.91 | -4.28 |
| Vischelbach | 1.62 | 0.10 | -0.77 | -0.05 | -0.19 |
| Weidenbach | 2.81 | -2.29 | -0.11 | -0.21 | -0.21 |
| Wirftbach | 1.73 | 0.30 | -1.31 | -0.31 | -0.39 |
1.0.9 Terrascope website with Python support
!pip3 install --extra-index-url https://artifactory.vgt.vito.be/api/pypi/python-packages/simple terracatalogueclient
Customize and run the following script:
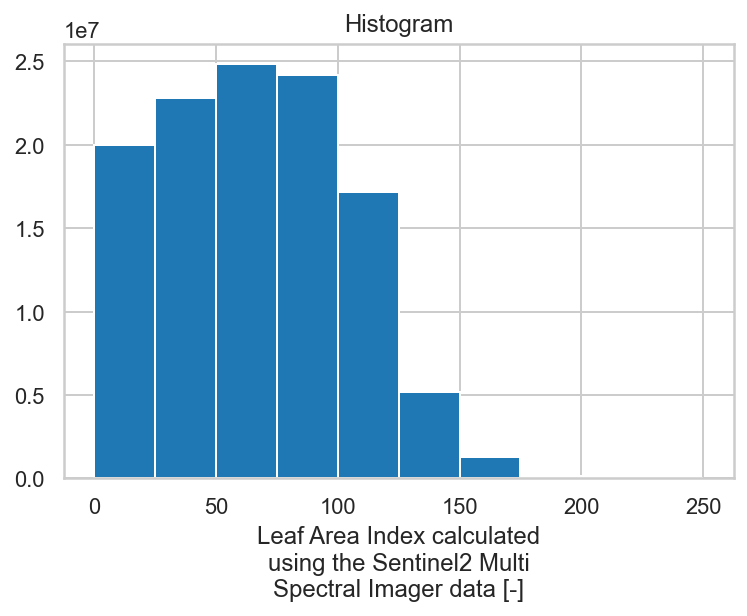
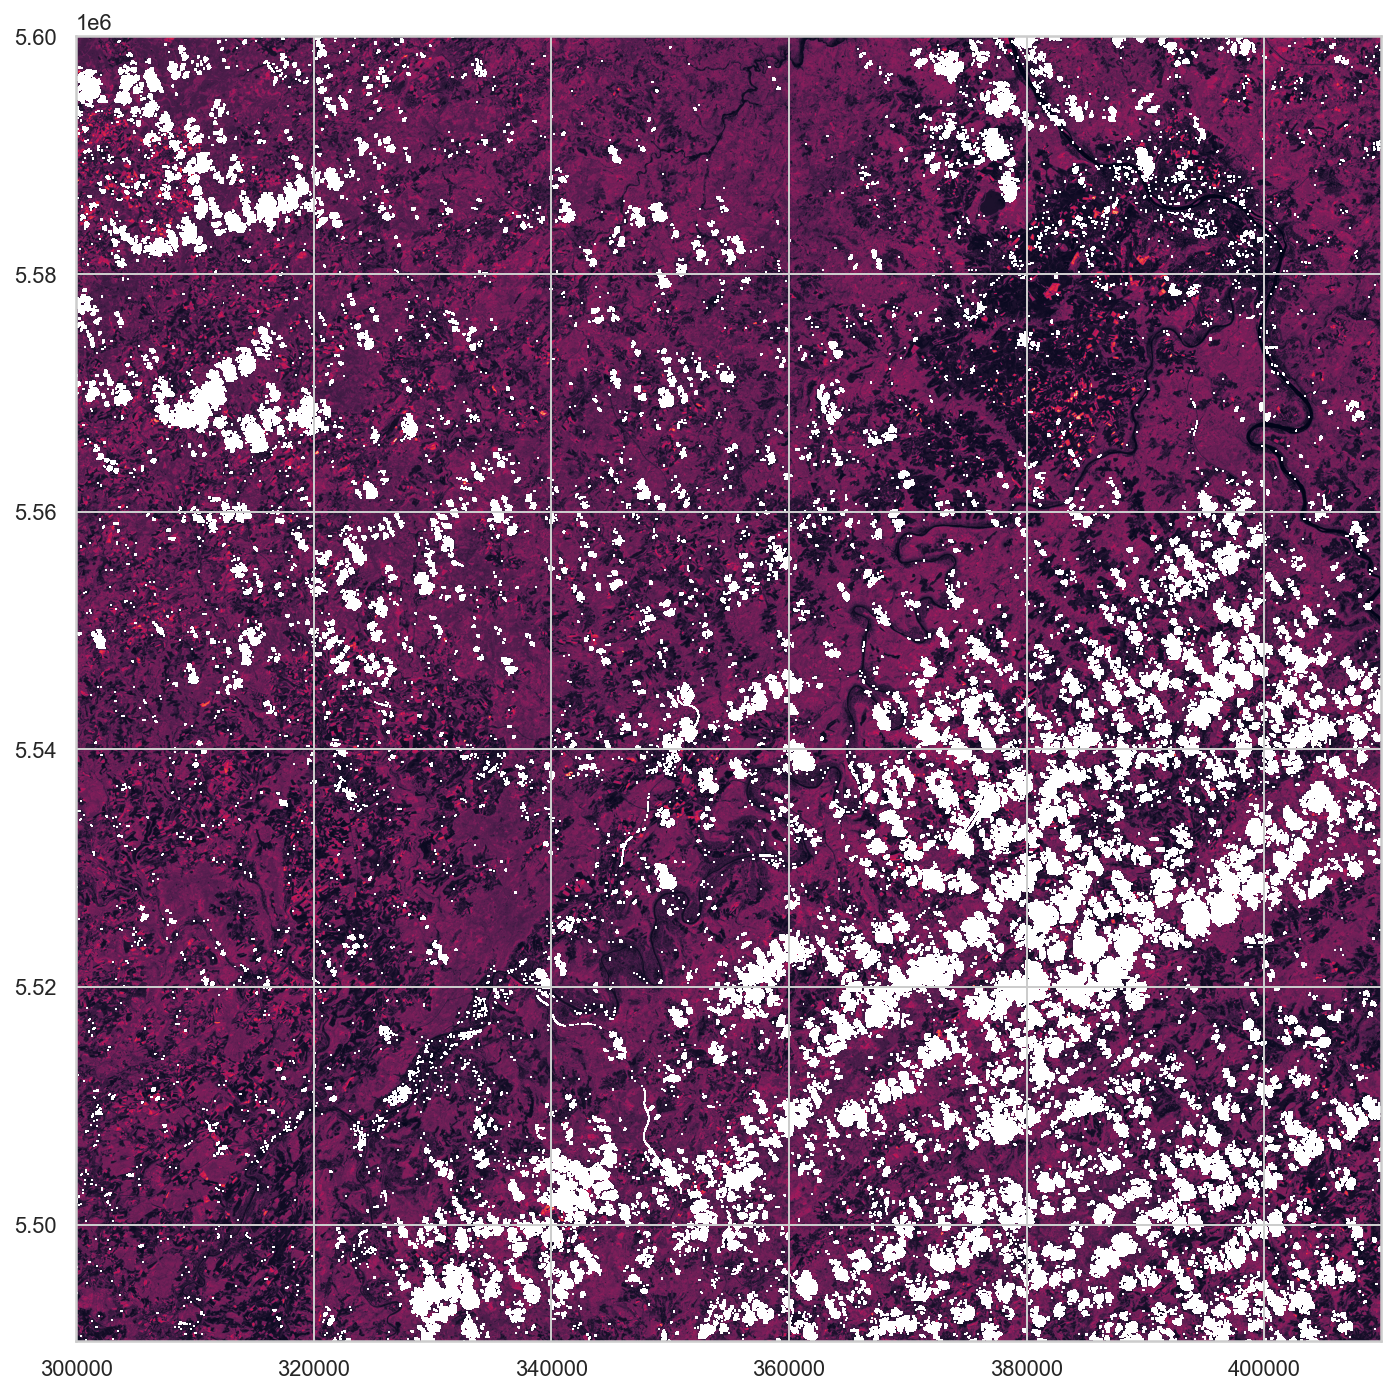
1.0.10 Leaf area index Terrascope
The leaf area index (LAI) is a response parameter for photosynthesis as it directly relates to the light interception and gas exchange through the stomata. It is a dimensionless biophysical variable, which is calculated as the ratio of leaf area to per unit ground surface area. Monitoring of the LAI provides an understanding of dynamic changes in productivity, climate impacts on terrestrial ecosystems, energy balance, canopy water interception, and gas exchange. Therefore, understanding of the LAI is a crucial parameter for physiological, ecological, and climatological studies.
The values of this "Terrascope" Leaf area index range from 0 to 8. Picea abies has an effective LAI range of 3 to 8, from 40 % to 0 % defoliation. Defoliation is related to stand age and density. Leaf area index of Norway spruce stands in relation to age and defoliation.
<xarray.DataArray (band: 1, y: 3241, x: 3949)>
[12798709 values with dtype=float32]
Coordinates:
  * band         (band) int32 1
  * x            (x) float64 3.274e+05 3.274e+05 ... 3.669e+05 3.669e+05
  * y            (y) float64 5.6e+06 5.6e+06 5.6e+06 ... 5.568e+06 5.568e+06
    spatial_ref  int32 0
Attributes:
    scale_factor:  1.0
add_offset: 0.0- band: 1
- y: 3241
- x: 3949
- ...
[12798709 values with dtype=float32]
- band(band)int321
array([1])
- x(x)float643.274e+05 3.274e+05 ... 3.669e+05
array([327425., 327435., 327445., ..., 366885., 366895., 366905.])
- y(y)float645.6e+06 5.6e+06 ... 5.568e+06
array([5600035., 5600025., 5600015., ..., 5567655., 5567645., 5567635.])
- spatial_ref()int320
- crs_wkt :
- PROJCS["WGS 84 / UTM zone 32N",GEOGCS["WGS 84",DATUM["WGS_1984",SPHEROID["WGS 84",6378137,298.257223563,AUTHORITY["EPSG","7030"]],AUTHORITY["EPSG","6326"]],PRIMEM["Greenwich",0],UNIT["degree",0.0174532925199433,AUTHORITY["EPSG","9122"]],AUTHORITY["EPSG","4326"]],PROJECTION["Transverse_Mercator"],PARAMETER["latitude_of_origin",0],PARAMETER["central_meridian",9],PARAMETER["scale_factor",0.9996],PARAMETER["false_easting",500000],PARAMETER["false_northing",0],UNIT["metre",1,AUTHORITY["EPSG","9001"]],AXIS["Easting",EAST],AXIS["Northing",NORTH],AUTHORITY["EPSG","32632"]]
- semi_major_axis :
- 6378137.0
- semi_minor_axis :
- 6356752.314245179
- inverse_flattening :
- 298.257223563
- reference_ellipsoid_name :
- WGS 84
- longitude_of_prime_meridian :
- 0.0
- prime_meridian_name :
- Greenwich
- geographic_crs_name :
- WGS 84
- horizontal_datum_name :
- World Geodetic System 1984
- projected_crs_name :
- WGS 84 / UTM zone 32N
- grid_mapping_name :
- transverse_mercator
- latitude_of_projection_origin :
- 0.0
- longitude_of_central_meridian :
- 9.0
- false_easting :
- 500000.0
- false_northing :
- 0.0
- scale_factor_at_central_meridian :
- 0.9996
- spatial_ref :
- PROJCS["WGS 84 / UTM zone 32N",GEOGCS["WGS 84",DATUM["WGS_1984",SPHEROID["WGS 84",6378137,298.257223563,AUTHORITY["EPSG","7030"]],AUTHORITY["EPSG","6326"]],PRIMEM["Greenwich",0],UNIT["degree",0.0174532925199433,AUTHORITY["EPSG","9122"]],AUTHORITY["EPSG","4326"]],PROJECTION["Transverse_Mercator"],PARAMETER["latitude_of_origin",0],PARAMETER["central_meridian",9],PARAMETER["scale_factor",0.9996],PARAMETER["false_easting",500000],PARAMETER["false_northing",0],UNIT["metre",1,AUTHORITY["EPSG","9001"]],AXIS["Easting",EAST],AXIS["Northing",NORTH],AUTHORITY["EPSG","32632"]]
- GeoTransform :
- 327420.0 10.0 0.0 5600040.0 0.0 -10.0
array(0)
- scale_factor :
- 1.0
- add_offset :
- 0.0
(array([ 557123., 1242962., 1771036., 1579836., 1087121.,  226332.,
          28482.,    1860.,      63.,     104.]),
 array([  0.,  25.,  50.,  75., 100., 125., 150., 175., 200., 225., 250.],
       dtype=float32),
 <BarContainer object of 10 artists>)
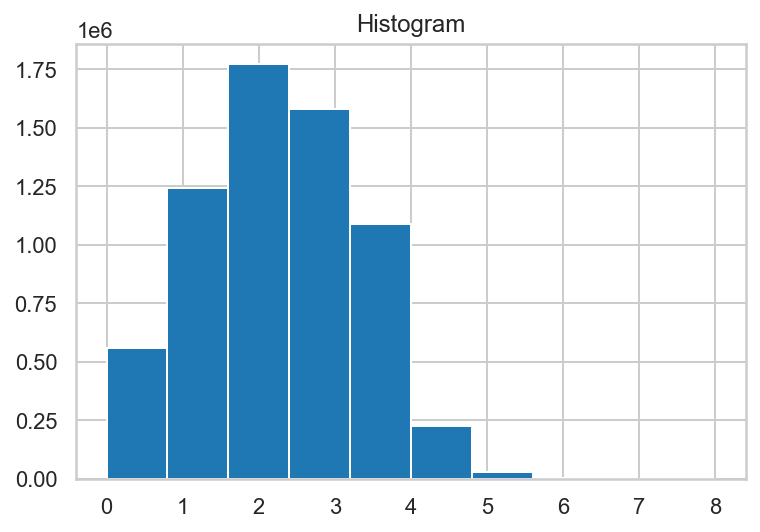
LAI histogram of the source map:
(array([19962032., 22822615., 24834645., 24183484., 17146888.,  5203523.,
         1296826.,   134381.,    15914.,     4883.]),
 array([  0.,  25.,  50.,  75., 100., 125., 150., 175., 200., 225., 250.],
       dtype=float32),
 <BarContainer object of 10 artists>)
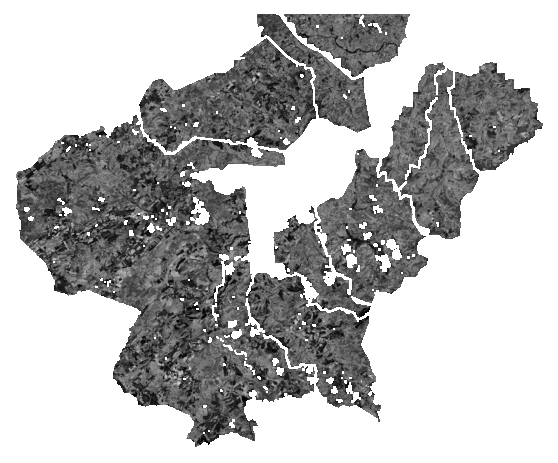
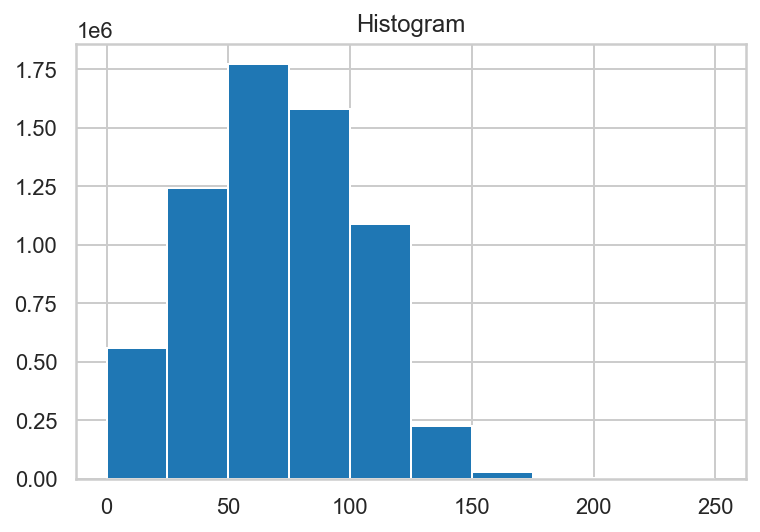
1.0.10.1 Masking a raster using a shapefile
Note: I rescaled the 0-255 range to a 0-8 range, but the technical document mentions the scale as 0.04, so the LAI values here should be corrected by *0.04/(8/255)
1.2750000000000001
<xarray.DataArray (band: 1, y: 6507, x: 5368)>
[34929576 values with dtype=float32]
Coordinates:
  * band         (band) int32 1
  * x            (x) float64 3.18e+05 3.18e+05 3.18e+05 ... 3.717e+05 3.717e+05
  * y            (y) float64 5.618e+06 5.618e+06 ... 5.553e+06 5.553e+06
    spatial_ref  int32 0
Attributes:
    scale_factor:  1.0
add_offset: 0.0- band: 1
- y: 6507
- x: 5368
- ...
[34929576 values with dtype=float32]
- band(band)int321
array([1])
- x(x)float643.18e+05 3.18e+05 ... 3.717e+05
array([318023.81367 , 318033.814409, 318043.815149, ..., 371677.781051, 371687.781791, 371697.78253 ]) - y(y)float645.618e+06 5.618e+06 ... 5.553e+06
array([5618462.896112, 5618452.895537, 5618442.894962, ..., 5553419.153738, 5553409.153163, 5553399.152588]) - spatial_ref()int320
- crs_wkt :
- PROJCS["WGS 84 / UTM zone 32N",GEOGCS["WGS 84",DATUM["WGS_1984",SPHEROID["WGS 84",6378137,298.257223563,AUTHORITY["EPSG","7030"]],AUTHORITY["EPSG","6326"]],PRIMEM["Greenwich",0],UNIT["degree",0.0174532925199433,AUTHORITY["EPSG","9122"]],AUTHORITY["EPSG","4326"]],PROJECTION["Transverse_Mercator"],PARAMETER["latitude_of_origin",0],PARAMETER["central_meridian",9],PARAMETER["scale_factor",0.9996],PARAMETER["false_easting",500000],PARAMETER["false_northing",0],UNIT["metre",1,AUTHORITY["EPSG","9001"]],AXIS["Easting",EAST],AXIS["Northing",NORTH],AUTHORITY["EPSG","32632"]]
- semi_major_axis :
- 6378137.0
- semi_minor_axis :
- 6356752.314245179
- inverse_flattening :
- 298.257223563
- reference_ellipsoid_name :
- WGS 84
- longitude_of_prime_meridian :
- 0.0
- prime_meridian_name :
- Greenwich
- geographic_crs_name :
- WGS 84
- horizontal_datum_name :
- World Geodetic System 1984
- projected_crs_name :
- WGS 84 / UTM zone 32N
- grid_mapping_name :
- transverse_mercator
- latitude_of_projection_origin :
- 0.0
- longitude_of_central_meridian :
- 9.0
- false_easting :
- 500000.0
- false_northing :
- 0.0
- scale_factor_at_central_meridian :
- 0.9996
- spatial_ref :
- PROJCS["WGS 84 / UTM zone 32N",GEOGCS["WGS 84",DATUM["WGS_1984",SPHEROID["WGS 84",6378137,298.257223563,AUTHORITY["EPSG","7030"]],AUTHORITY["EPSG","6326"]],PRIMEM["Greenwich",0],UNIT["degree",0.0174532925199433,AUTHORITY["EPSG","9122"]],AUTHORITY["EPSG","4326"]],PROJECTION["Transverse_Mercator"],PARAMETER["latitude_of_origin",0],PARAMETER["central_meridian",9],PARAMETER["scale_factor",0.9996],PARAMETER["false_easting",500000],PARAMETER["false_northing",0],UNIT["metre",1,AUTHORITY["EPSG","9001"]],AXIS["Easting",EAST],AXIS["Northing",NORTH],AUTHORITY["EPSG","32632"]]
- GeoTransform :
- 318018.8133 10.000739493293594 0.0 5618467.8964 0.0 -10.000575395727644
array(0)
- scale_factor :
- 1.0
- add_offset :
- 0.0
(array([ 557048., 1242907., 1771006., 1579822., 1087113.,  226329.,
          28482.,    1860.,      63.,     104.]),
 array([0. , 0.8, 1.6, 2.4, 3.2, 4. , 4.8, 5.6, 6.4, 7.2, 8. ],
       dtype=float32),
 <BarContainer object of 10 artists>)
<xarray.DataArray ()>
array(2.24, dtype=float32)
Coordinates:
spatial_ref int32 0- 2.241
array(2.24, dtype=float32)
- spatial_ref()int320
- crs_wkt :
- PROJCS["WGS 84 / UTM zone 32N",GEOGCS["WGS 84",DATUM["WGS_1984",SPHEROID["WGS 84",6378137,298.257223563,AUTHORITY["EPSG","7030"]],AUTHORITY["EPSG","6326"]],PRIMEM["Greenwich",0],UNIT["degree",0.0174532925199433,AUTHORITY["EPSG","9122"]],AUTHORITY["EPSG","4326"]],PROJECTION["Transverse_Mercator"],PARAMETER["latitude_of_origin",0],PARAMETER["central_meridian",9],PARAMETER["scale_factor",0.9996],PARAMETER["false_easting",500000],PARAMETER["false_northing",0],UNIT["metre",1,AUTHORITY["EPSG","9001"]],AXIS["Easting",EAST],AXIS["Northing",NORTH],AUTHORITY["EPSG","32632"]]
- semi_major_axis :
- 6378137.0
- semi_minor_axis :
- 6356752.314245179
- inverse_flattening :
- 298.257223563
- reference_ellipsoid_name :
- WGS 84
- longitude_of_prime_meridian :
- 0.0
- prime_meridian_name :
- Greenwich
- geographic_crs_name :
- WGS 84
- horizontal_datum_name :
- World Geodetic System 1984
- projected_crs_name :
- WGS 84 / UTM zone 32N
- grid_mapping_name :
- transverse_mercator
- latitude_of_projection_origin :
- 0.0
- longitude_of_central_meridian :
- 9.0
- false_easting :
- 500000.0
- false_northing :
- 0.0
- scale_factor_at_central_meridian :
- 0.9996
- spatial_ref :
- PROJCS["WGS 84 / UTM zone 32N",GEOGCS["WGS 84",DATUM["WGS_1984",SPHEROID["WGS 84",6378137,298.257223563,AUTHORITY["EPSG","7030"]],AUTHORITY["EPSG","6326"]],PRIMEM["Greenwich",0],UNIT["degree",0.0174532925199433,AUTHORITY["EPSG","9122"]],AUTHORITY["EPSG","4326"]],PROJECTION["Transverse_Mercator"],PARAMETER["latitude_of_origin",0],PARAMETER["central_meridian",9],PARAMETER["scale_factor",0.9996],PARAMETER["false_easting",500000],PARAMETER["false_northing",0],UNIT["metre",1,AUTHORITY["EPSG","9001"]],AXIS["Easting",EAST],AXIS["Northing",NORTH],AUTHORITY["EPSG","32632"]]
- GeoTransform :
- 318018.8133 10.000739493293594 0.0 5618467.8964 0.0 -10.000575395727644
array(0)
To get rid of the patches with clouds and cloud shadows, we'll filter out the values under LAI index value 1:
<xarray.DataArray ()>
array(2.43, dtype=float32)
Coordinates:
spatial_ref int32 0- 2.433
array(2.43, dtype=float32)
- spatial_ref()int320
- crs_wkt :
- PROJCS["WGS 84 / UTM zone 32N",GEOGCS["WGS 84",DATUM["WGS_1984",SPHEROID["WGS 84",6378137,298.257223563,AUTHORITY["EPSG","7030"]],AUTHORITY["EPSG","6326"]],PRIMEM["Greenwich",0],UNIT["degree",0.0174532925199433,AUTHORITY["EPSG","9122"]],AUTHORITY["EPSG","4326"]],PROJECTION["Transverse_Mercator"],PARAMETER["latitude_of_origin",0],PARAMETER["central_meridian",9],PARAMETER["scale_factor",0.9996],PARAMETER["false_easting",500000],PARAMETER["false_northing",0],UNIT["metre",1,AUTHORITY["EPSG","9001"]],AXIS["Easting",EAST],AXIS["Northing",NORTH],AUTHORITY["EPSG","32632"]]
- semi_major_axis :
- 6378137.0
- semi_minor_axis :
- 6356752.314245179
- inverse_flattening :
- 298.257223563
- reference_ellipsoid_name :
- WGS 84
- longitude_of_prime_meridian :
- 0.0
- prime_meridian_name :
- Greenwich
- geographic_crs_name :
- WGS 84
- horizontal_datum_name :
- World Geodetic System 1984
- projected_crs_name :
- WGS 84 / UTM zone 32N
- grid_mapping_name :
- transverse_mercator
- latitude_of_projection_origin :
- 0.0
- longitude_of_central_meridian :
- 9.0
- false_easting :
- 500000.0
- false_northing :
- 0.0
- scale_factor_at_central_meridian :
- 0.9996
- spatial_ref :
- PROJCS["WGS 84 / UTM zone 32N",GEOGCS["WGS 84",DATUM["WGS_1984",SPHEROID["WGS 84",6378137,298.257223563,AUTHORITY["EPSG","7030"]],AUTHORITY["EPSG","6326"]],PRIMEM["Greenwich",0],UNIT["degree",0.0174532925199433,AUTHORITY["EPSG","9122"]],AUTHORITY["EPSG","4326"]],PROJECTION["Transverse_Mercator"],PARAMETER["latitude_of_origin",0],PARAMETER["central_meridian",9],PARAMETER["scale_factor",0.9996],PARAMETER["false_easting",500000],PARAMETER["false_northing",0],UNIT["metre",1,AUTHORITY["EPSG","9001"]],AXIS["Easting",EAST],AXIS["Northing",NORTH],AUTHORITY["EPSG","32632"]]
- GeoTransform :
- 318018.8133 10.000739493293594 0.0 5618467.8964 0.0 -10.000575395727644
array(0)
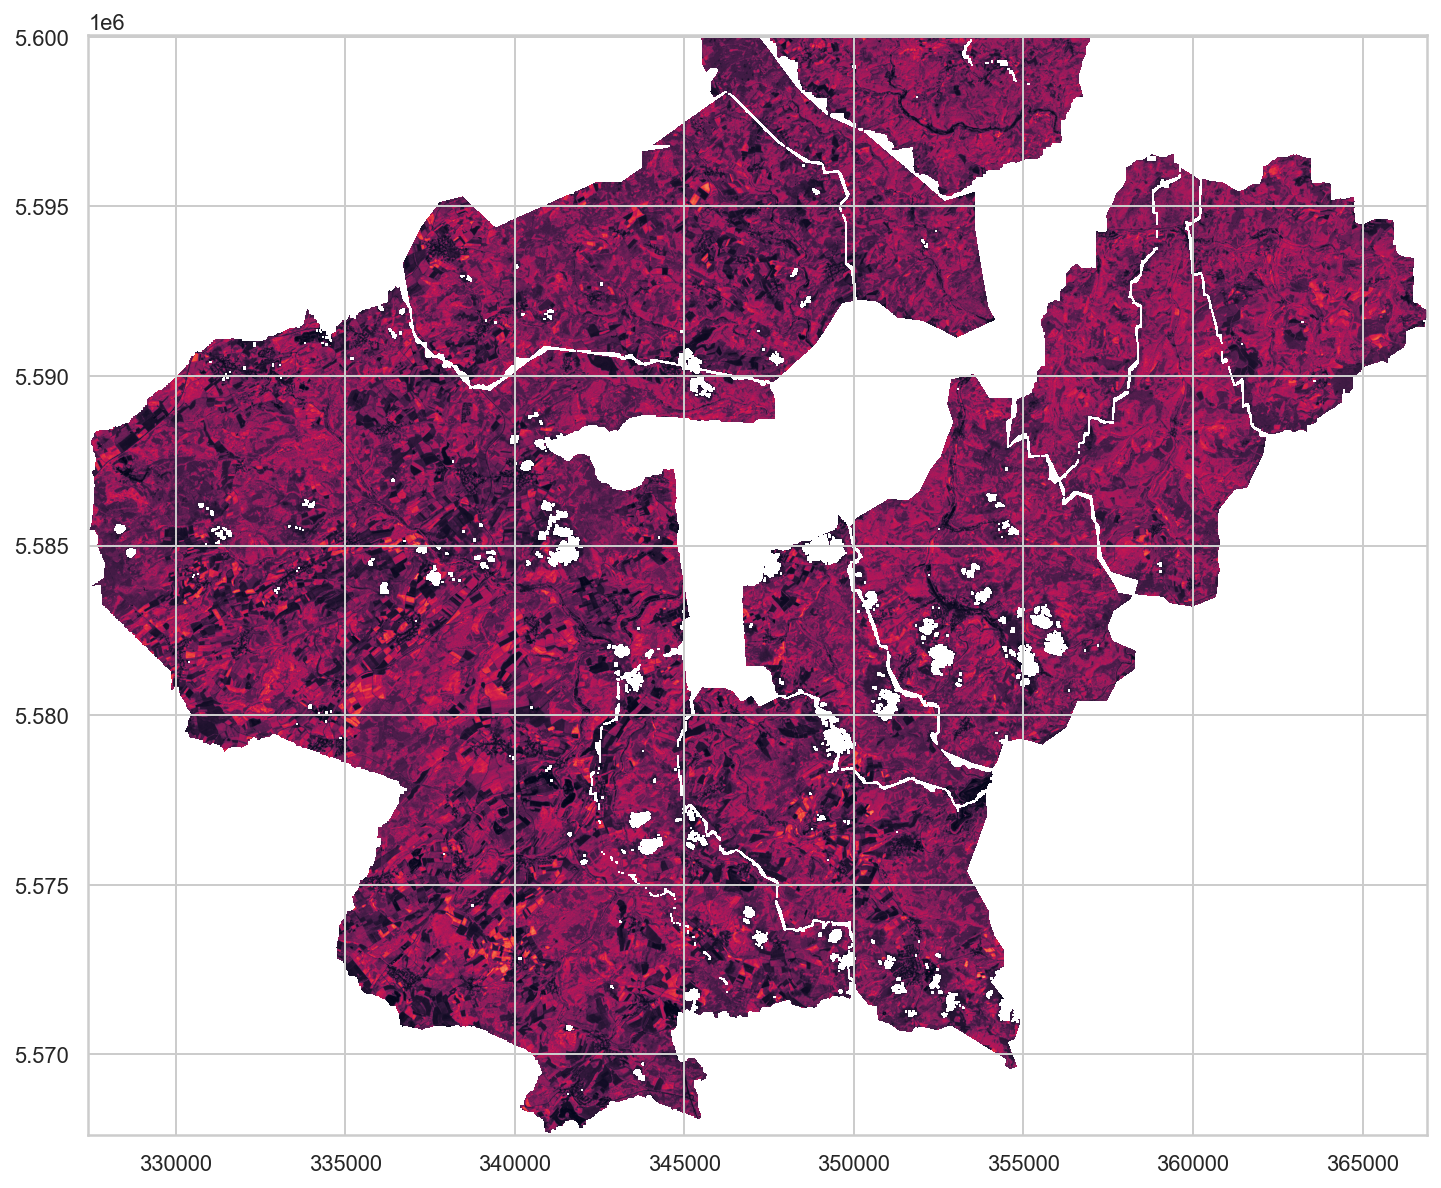
The Upper Ahr area has much more black patches than for ex. the Weidenbach or Dennbach area. I suspect that forced fellings of trees infested with Ips Typographus or the European spruce beetle is the reason. Spruce= genus Picea The dry years of 2017 and 2018 made it easier for the beetle to spread out. On the otherhand, the genus Pinus has had troubles with the damage caused by the Phenops cyanea.
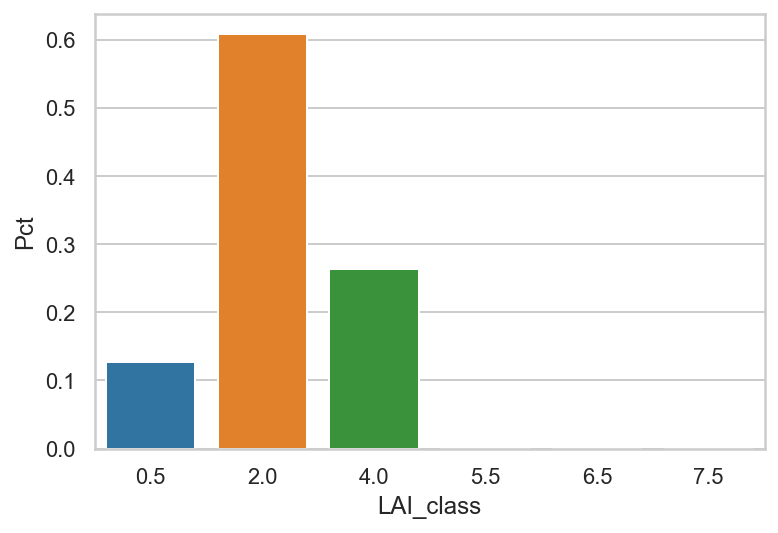
1.0.10.2 The GeoTiff rescaled to a 0 - 8 LAI-index.
The LAI-index is well estimated up to values of 6, reads the technical documentation.
| LAI_class | Aantal pixels | Vlak (m²) | |
|---|---|---|---|
| 0 | 0.5 | 824088 | 8.24e+07 |
| 1 | 2.0 | 3946594 | 3.95e+08 |
| 2 | 4.0 | 1708485 | 1.71e+08 |
| 3 | 5.5 | 15149 | 1.52e+06 |
| 4 | 6.5 | 312 | 3.12e+04 |
| 5 | 7.5 | 106 | 1.06e+04 |
0.16666666666666666
| LAI_class | Aantal pixels | Vlak (m²) | Pct | |
|---|---|---|---|---|
| 0 | 0.5 | 824088 | 8.24e+07 | 1.27e-01 |
| 1 | 2.0 | 3946594 | 3.95e+08 | 6.08e-01 |
| 2 | 4.0 | 1708485 | 1.71e+08 | 2.63e-01 |
| 3 | 5.5 | 15149 | 1.52e+06 | 2.33e-03 |
| 4 | 6.5 | 312 | 3.12e+04 | 4.80e-05 |
| 5 | 7.5 | 106 | 1.06e+04 | 1.63e-05 |
<AxesSubplot:xlabel='LAI_class', ylabel='Pct'>
Theoretically as well as practically, strong relationship between LAI and DIFN values exists:

(𝐿𝐴𝐼-0.0033)/−2.639 =𝑙𝑛(𝐷𝐼𝐹𝑁)
<xarray.DataArray ()>
array(0.4)
Coordinates:
spatial_ref int32 0- 0.3983
array(0.4)
- spatial_ref()int320
- crs_wkt :
- PROJCS["WGS 84 / UTM zone 32N",GEOGCS["WGS 84",DATUM["WGS_1984",SPHEROID["WGS 84",6378137,298.257223563,AUTHORITY["EPSG","7030"]],AUTHORITY["EPSG","6326"]],PRIMEM["Greenwich",0],UNIT["degree",0.0174532925199433,AUTHORITY["EPSG","9122"]],AUTHORITY["EPSG","4326"]],PROJECTION["Transverse_Mercator"],PARAMETER["latitude_of_origin",0],PARAMETER["central_meridian",9],PARAMETER["scale_factor",0.9996],PARAMETER["false_easting",500000],PARAMETER["false_northing",0],UNIT["metre",1,AUTHORITY["EPSG","9001"]],AXIS["Easting",EAST],AXIS["Northing",NORTH],AUTHORITY["EPSG","32632"]]
- semi_major_axis :
- 6378137.0
- semi_minor_axis :
- 6356752.314245179
- inverse_flattening :
- 298.257223563
- reference_ellipsoid_name :
- WGS 84
- longitude_of_prime_meridian :
- 0.0
- prime_meridian_name :
- Greenwich
- geographic_crs_name :
- WGS 84
- horizontal_datum_name :
- World Geodetic System 1984
- projected_crs_name :
- WGS 84 / UTM zone 32N
- grid_mapping_name :
- transverse_mercator
- latitude_of_projection_origin :
- 0.0
- longitude_of_central_meridian :
- 9.0
- false_easting :
- 500000.0
- false_northing :
- 0.0
- scale_factor_at_central_meridian :
- 0.9996
- spatial_ref :
- PROJCS["WGS 84 / UTM zone 32N",GEOGCS["WGS 84",DATUM["WGS_1984",SPHEROID["WGS 84",6378137,298.257223563,AUTHORITY["EPSG","7030"]],AUTHORITY["EPSG","6326"]],PRIMEM["Greenwich",0],UNIT["degree",0.0174532925199433,AUTHORITY["EPSG","9122"]],AUTHORITY["EPSG","4326"]],PROJECTION["Transverse_Mercator"],PARAMETER["latitude_of_origin",0],PARAMETER["central_meridian",9],PARAMETER["scale_factor",0.9996],PARAMETER["false_easting",500000],PARAMETER["false_northing",0],UNIT["metre",1,AUTHORITY["EPSG","9001"]],AXIS["Easting",EAST],AXIS["Northing",NORTH],AUTHORITY["EPSG","32632"]]
- GeoTransform :
- 318018.8133 10.000739493293594 0.0 5618467.8964 0.0 -10.000575395727644
array(0)
<xarray.DataArray ()>
array(0.39)
Coordinates:
spatial_ref int32 0- 0.3894
array(0.39)
- spatial_ref()int320
- crs_wkt :
- PROJCS["WGS 84 / UTM zone 32N",GEOGCS["WGS 84",DATUM["WGS_1984",SPHEROID["WGS 84",6378137,298.257223563,AUTHORITY["EPSG","7030"]],AUTHORITY["EPSG","6326"]],PRIMEM["Greenwich",0],UNIT["degree",0.0174532925199433,AUTHORITY["EPSG","9122"]],AUTHORITY["EPSG","4326"]],PROJECTION["Transverse_Mercator"],PARAMETER["latitude_of_origin",0],PARAMETER["central_meridian",9],PARAMETER["scale_factor",0.9996],PARAMETER["false_easting",500000],PARAMETER["false_northing",0],UNIT["metre",1,AUTHORITY["EPSG","9001"]],AXIS["Easting",EAST],AXIS["Northing",NORTH],AUTHORITY["EPSG","32632"]]
- semi_major_axis :
- 6378137.0
- semi_minor_axis :
- 6356752.314245179
- inverse_flattening :
- 298.257223563
- reference_ellipsoid_name :
- WGS 84
- longitude_of_prime_meridian :
- 0.0
- prime_meridian_name :
- Greenwich
- geographic_crs_name :
- WGS 84
- horizontal_datum_name :
- World Geodetic System 1984
- projected_crs_name :
- WGS 84 / UTM zone 32N
- grid_mapping_name :
- transverse_mercator
- latitude_of_projection_origin :
- 0.0
- longitude_of_central_meridian :
- 9.0
- false_easting :
- 500000.0
- false_northing :
- 0.0
- scale_factor_at_central_meridian :
- 0.9996
- spatial_ref :
- PROJCS["WGS 84 / UTM zone 32N",GEOGCS["WGS 84",DATUM["WGS_1984",SPHEROID["WGS 84",6378137,298.257223563,AUTHORITY["EPSG","7030"]],AUTHORITY["EPSG","6326"]],PRIMEM["Greenwich",0],UNIT["degree",0.0174532925199433,AUTHORITY["EPSG","9122"]],AUTHORITY["EPSG","4326"]],PROJECTION["Transverse_Mercator"],PARAMETER["latitude_of_origin",0],PARAMETER["central_meridian",9],PARAMETER["scale_factor",0.9996],PARAMETER["false_easting",500000],PARAMETER["false_northing",0],UNIT["metre",1,AUTHORITY["EPSG","9001"]],AXIS["Easting",EAST],AXIS["Northing",NORTH],AUTHORITY["EPSG","32632"]]
- GeoTransform :
- 318018.8133 10.000739493293594 0.0 5618467.8964 0.0 -10.000575395727644
array(0)
1.0.10.3 Masking a combined raster using a shape: Upper Ahr
We clip the raster of forest area 2019 data, overlayed with the LAI index, with the Upper Ahr shapefile. The forest area 2019 data were multiplied by 10 to separate them from non-forest values, which were not altered.
<AxesSubplot:>
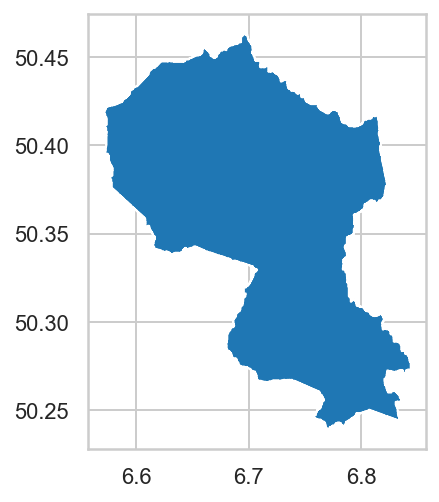
c:\program files\python38\lib\site-packages\rasterio\mask.py:88: UserWarning: shapes are outside bounds of raster. Are they in different coordinate reference systems?
  warnings.warn('shapes are outside bounds of raster. '
<xarray.DataArray (band: 1, y: 6507, x: 5368)>
[34929576 values with dtype=float32]
Coordinates:
  * band         (band) int32 1
  * x            (x) float64 3.18e+05 3.18e+05 3.18e+05 ... 3.717e+05 3.717e+05
  * y            (y) float64 5.618e+06 5.618e+06 ... 5.553e+06 5.553e+06
    spatial_ref  int32 0
Attributes:
    scale_factor:  1.0
add_offset: 0.0- band: 1
- y: 6507
- x: 5368
- ...
[34929576 values with dtype=float32]
- band(band)int321
array([1])
- x(x)float643.18e+05 3.18e+05 ... 3.717e+05
array([318023.81367 , 318033.814409, 318043.815149, ..., 371677.781051, 371687.781791, 371697.78253 ]) - y(y)float645.618e+06 5.618e+06 ... 5.553e+06
array([5618462.896112, 5618452.895537, 5618442.894962, ..., 5553419.153738, 5553409.153163, 5553399.152588]) - spatial_ref()int320
- crs_wkt :
- PROJCS["WGS 84 / UTM zone 32N",GEOGCS["WGS 84",DATUM["WGS_1984",SPHEROID["WGS 84",6378137,298.257223563,AUTHORITY["EPSG","7030"]],AUTHORITY["EPSG","6326"]],PRIMEM["Greenwich",0],UNIT["degree",0.0174532925199433,AUTHORITY["EPSG","9122"]],AUTHORITY["EPSG","4326"]],PROJECTION["Transverse_Mercator"],PARAMETER["latitude_of_origin",0],PARAMETER["central_meridian",9],PARAMETER["scale_factor",0.9996],PARAMETER["false_easting",500000],PARAMETER["false_northing",0],UNIT["metre",1,AUTHORITY["EPSG","9001"]],AXIS["Easting",EAST],AXIS["Northing",NORTH],AUTHORITY["EPSG","32632"]]
- semi_major_axis :
- 6378137.0
- semi_minor_axis :
- 6356752.314245179
- inverse_flattening :
- 298.257223563
- reference_ellipsoid_name :
- WGS 84
- longitude_of_prime_meridian :
- 0.0
- prime_meridian_name :
- Greenwich
- geographic_crs_name :
- WGS 84
- horizontal_datum_name :
- World Geodetic System 1984
- projected_crs_name :
- WGS 84 / UTM zone 32N
- grid_mapping_name :
- transverse_mercator
- latitude_of_projection_origin :
- 0.0
- longitude_of_central_meridian :
- 9.0
- false_easting :
- 500000.0
- false_northing :
- 0.0
- scale_factor_at_central_meridian :
- 0.9996
- spatial_ref :
- PROJCS["WGS 84 / UTM zone 32N",GEOGCS["WGS 84",DATUM["WGS_1984",SPHEROID["WGS 84",6378137,298.257223563,AUTHORITY["EPSG","7030"]],AUTHORITY["EPSG","6326"]],PRIMEM["Greenwich",0],UNIT["degree",0.0174532925199433,AUTHORITY["EPSG","9122"]],AUTHORITY["EPSG","4326"]],PROJECTION["Transverse_Mercator"],PARAMETER["latitude_of_origin",0],PARAMETER["central_meridian",9],PARAMETER["scale_factor",0.9996],PARAMETER["false_easting",500000],PARAMETER["false_northing",0],UNIT["metre",1,AUTHORITY["EPSG","9001"]],AXIS["Easting",EAST],AXIS["Northing",NORTH],AUTHORITY["EPSG","32632"]]
- GeoTransform :
- 318018.8133 10.000739493293594 0.0 5618467.8964 0.0 -10.000575395727644
array(0)
- scale_factor :
- 1.0
- add_offset :
- 0.0
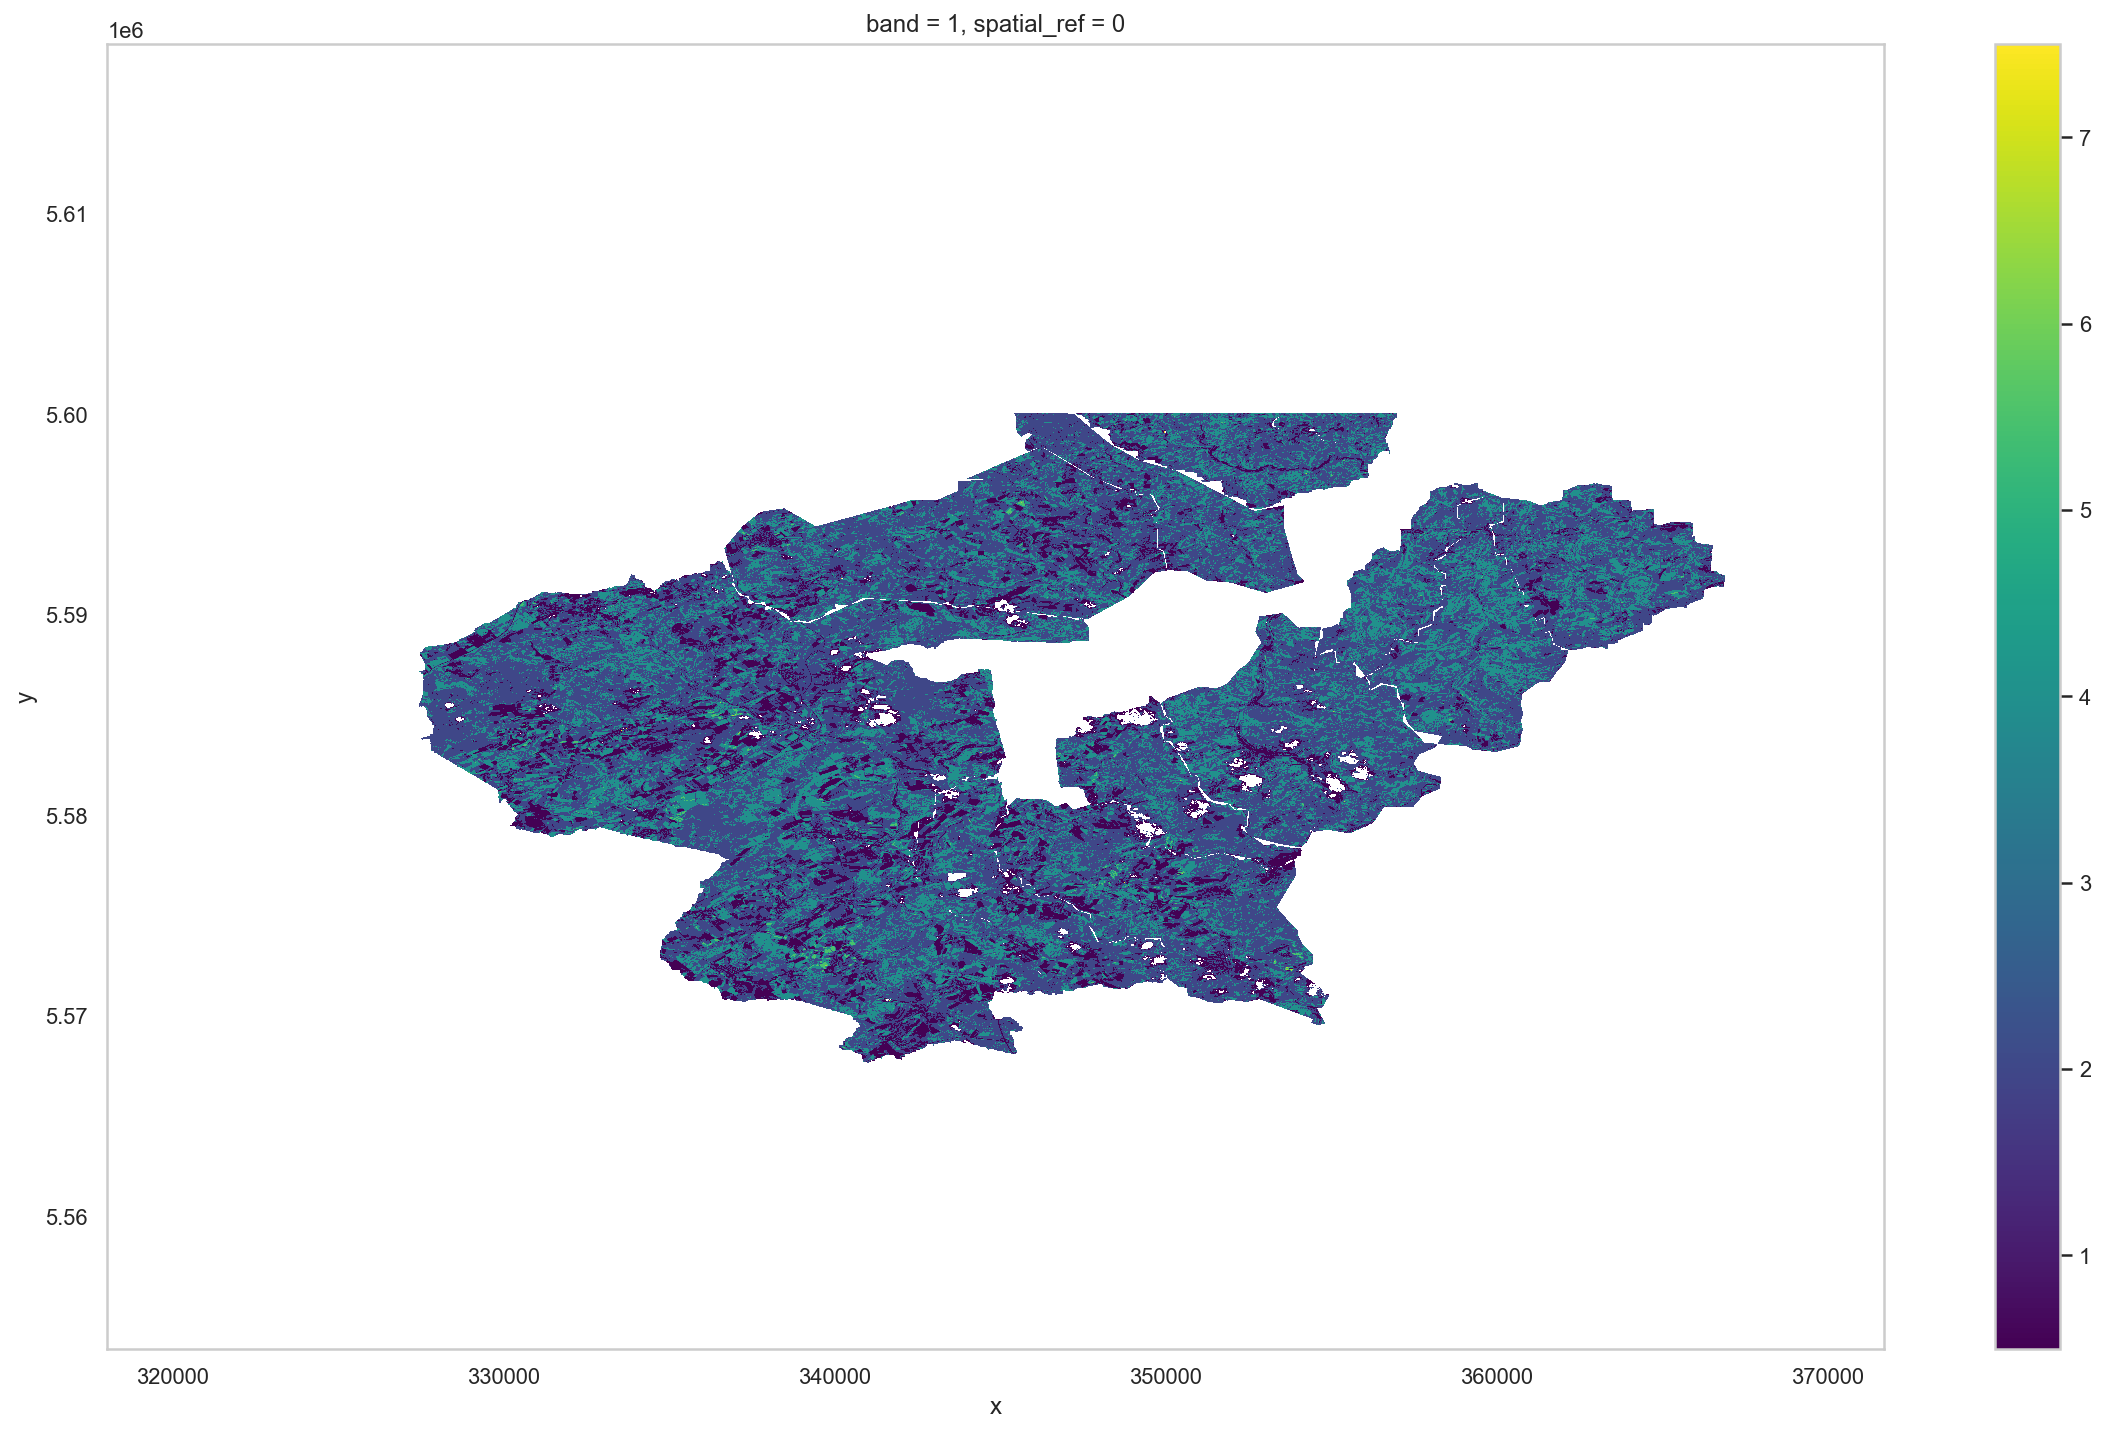
| value | count | m² | geometry | |
|---|---|---|---|---|
| 0 | 0.03 | 1 | 100.09 | None |
| 1 | 0.06 | 5 | 500.46 | None |
| 2 | 0.10 | 27 | 2702.51 | None |
| 3 | 0.13 | 31 | 3102.88 | None |
| 4 | 0.16 | 35 | 3503.25 | None |
| ... | ... | ... | ... | ... |
| 346 | 15.41 | 1 | 100.09 | None |
| 347 | 15.44 | 2 | 200.19 | None |
| 348 | 15.54 | 1 | 100.09 | None |
| 349 | 15.98 | 1 | 100.09 | None |
| 350 | 16.62 | 1 | 100.09 | None |
351 rows × 4 columns
| value | count | m² | LAImean_10_9 | m2_sum | geometry | |
|---|---|---|---|---|---|---|
| 387 | 15.47 | 5 | 500.07 | 0.4 | 2.49e+08 | None |
| 388 | 15.50 | 8 | 800.11 | 0.4 | 2.49e+08 | None |
| 389 | 15.54 | 3 | 300.04 | 0.4 | 2.49e+08 | None |
| 390 | 15.57 | 6 | 600.08 | 0.4 | 2.49e+08 | None |
| 391 | 15.60 | 8 | 800.11 | 0.4 | 2.49e+08 | None |
| 392 | 15.63 | 4 | 400.05 | 0.4 | 2.49e+08 | None |
| 393 | 15.66 | 4 | 400.05 | 0.4 | 2.49e+08 | None |
| 394 | 15.70 | 2 | 200.03 | 0.4 | 2.49e+08 | None |
| 395 | 15.73 | 2 | 200.03 | 0.4 | 2.49e+08 | None |
| 396 | 15.76 | 1 | 100.01 | 0.4 | 2.49e+08 | None |
| 397 | 15.79 | 2 | 200.03 | 0.4 | 2.49e+08 | None |
| 398 | 15.82 | 1 | 100.01 | 0.4 | 2.49e+08 | None |
| 399 | 15.86 | 1 | 100.01 | 0.4 | 2.49e+08 | None |
| 400 | 15.89 | 1 | 100.01 | 0.4 | 2.49e+08 | None |
| 401 | 15.95 | 1 | 100.01 | 0.4 | 2.49e+08 | None |
| 402 | 15.98 | 1 | 100.01 | 0.4 | 2.49e+08 | None |
| 403 | 16.11 | 1 | 100.01 | 0.4 | 2.49e+08 | None |
| 404 | 16.14 | 3 | 300.04 | 0.4 | 2.49e+08 | None |
| 405 | 16.18 | 1 | 100.01 | 0.4 | 2.49e+08 | None |
| 406 | 16.24 | 1 | 100.01 | 0.4 | 2.49e+08 | None |
| value | count | m² | LAImean_10_9 | m2_sum | geometry | |
|---|---|---|---|---|---|---|
| 0 | 1.00e-03 | 776 | 77610.20 | 0.4 | 2.49e+08 | None |
| 1 | 3.30e-02 | 1777 | 177723.37 | 0.4 | 2.49e+08 | None |
| 2 | 6.50e-02 | 2651 | 265134.86 | 0.4 | 2.49e+08 | None |
| 3 | 9.70e-02 | 3367 | 336744.27 | 0.4 | 2.49e+08 | None |
| 4 | 1.29e-01 | 3949 | 394951.93 | 0.4 | 2.49e+08 | None |
| 5 | 1.61e-01 | 4589 | 458960.34 | 0.4 | 2.49e+08 | None |
| 6 | 1.93e-01 | 5131 | 513167.47 | 0.4 | 2.49e+08 | None |
| 7 | 2.25e-01 | 5805 | 580576.33 | 0.4 | 2.49e+08 | None |
| 8 | 2.57e-01 | 6223 | 622381.83 | 0.4 | 2.49e+08 | None |
| 9 | 2.89e-01 | 7052 | 705292.73 | 0.4 | 2.49e+08 | None |
| 10 | 3.21e-01 | 8093 | 809406.42 | 0.4 | 2.49e+08 | None |
| 11 | 3.53e-01 | 9272 | 927321.92 | 0.4 | 2.49e+08 | None |
We only pick the area's classified as forest in 2019 , with a correction on the initial rescaling.
| value | count | m² | geometry | |
|---|---|---|---|---|
| 193 | 10.51 | 106 | 10609.84 | None |
| 194 | 10.54 | 135 | 13512.54 | None |
| 195 | 10.58 | 131 | 13112.16 | None |
| 196 | 10.61 | 149 | 14913.84 | None |
| 197 | 10.64 | 152 | 15214.11 | None |
| ... | ... | ... | ... | ... |
| 346 | 15.41 | 1 | 100.09 | None |
| 347 | 15.44 | 2 | 200.19 | None |
| 348 | 15.54 | 1 | 100.09 | None |
| 349 | 15.98 | 1 | 100.09 | None |
| 350 | 16.62 | 1 | 100.09 | None |
158 rows × 4 columns
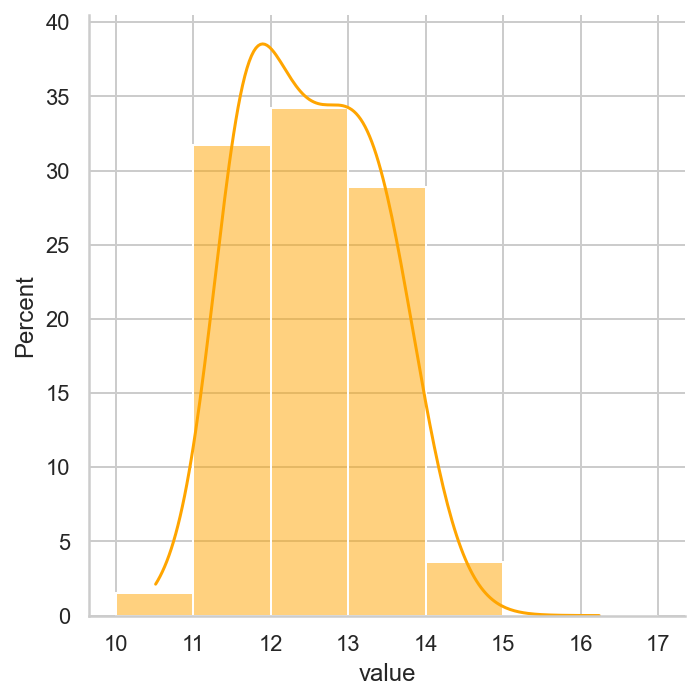
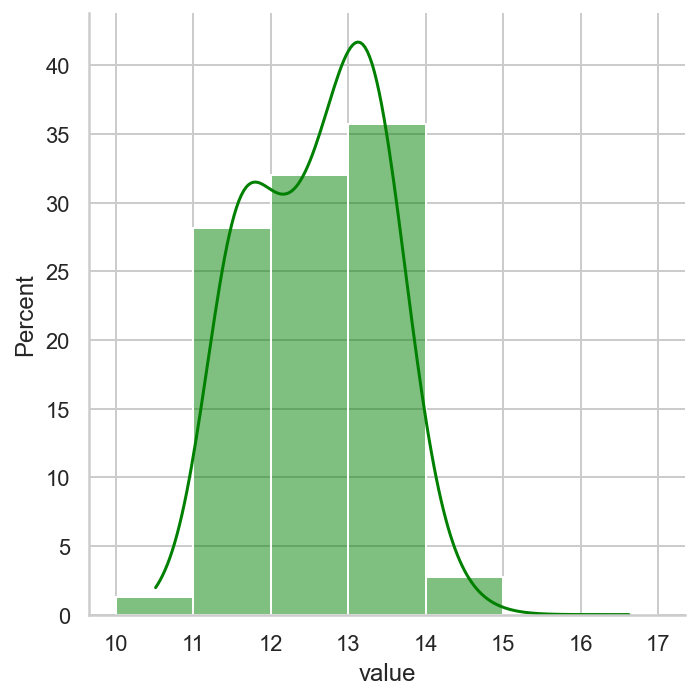
The Weidenbach forest shows more reflectance in the index range 3-4. In short it has healthier vegetation.
0.48705000000000004 7.956 13.8975 10.200000000000001
1.0.11 NDVI index via PROBA-V
Normalized difference vegetation index data obtained via remote sensing visible RGB and near IR. These maps and metadata were downloaded via the Terrascope website of VITO.
The Normalized Difference Vegetation Index (NDVI) is an index of
plant greenness or photosynthetic activity, and is one of the most
commonly used vegetation indices. Vegetation indices are based on the
observation that different surfaces reflect different types of light
differently. Photosynthetically active vegetation, in particular,
absorbs most of the red light that hits it while reflecting much of the
near infrared light. Vegetation that is dead or stressed reflects more
red light and less near infrared light. Likewise, non-vegetated surfaces
have a much more even reflectance across the light spectrum.
By taking the ratio of red and near infrared bands from a
remotely-sensed image, an index of vegetation “greenness” can be
defined. The NDVI is probably the most common of these ratio indices for
vegetation. NDVI is calculated on a per-pixel basis as the normalized
difference between the red and near infrared bands from an image,
where NIR is the near infrared band value for a cell and RED is the red
band value for the cell. NDVI can be calculated for any image that has a
red and a near infrared band. The biophysical interpretation of NDVI is
the fraction of absorbed photosynthetically active radiation.
Red band mean: 88.31570434570312
c:\program files\python38\lib\site-packages\geopandas\_compat.py:111: UserWarning: The Shapely GEOS version (3.8.1-CAPI-1.13.3) is incompatible with the GEOS version PyGEOS was compiled with (3.10.0-CAPI-1.16.0). Conversions between both will be slow.
  warnings.warn(
(1, 10980, 10980)
CRS.from_epsg(32632)
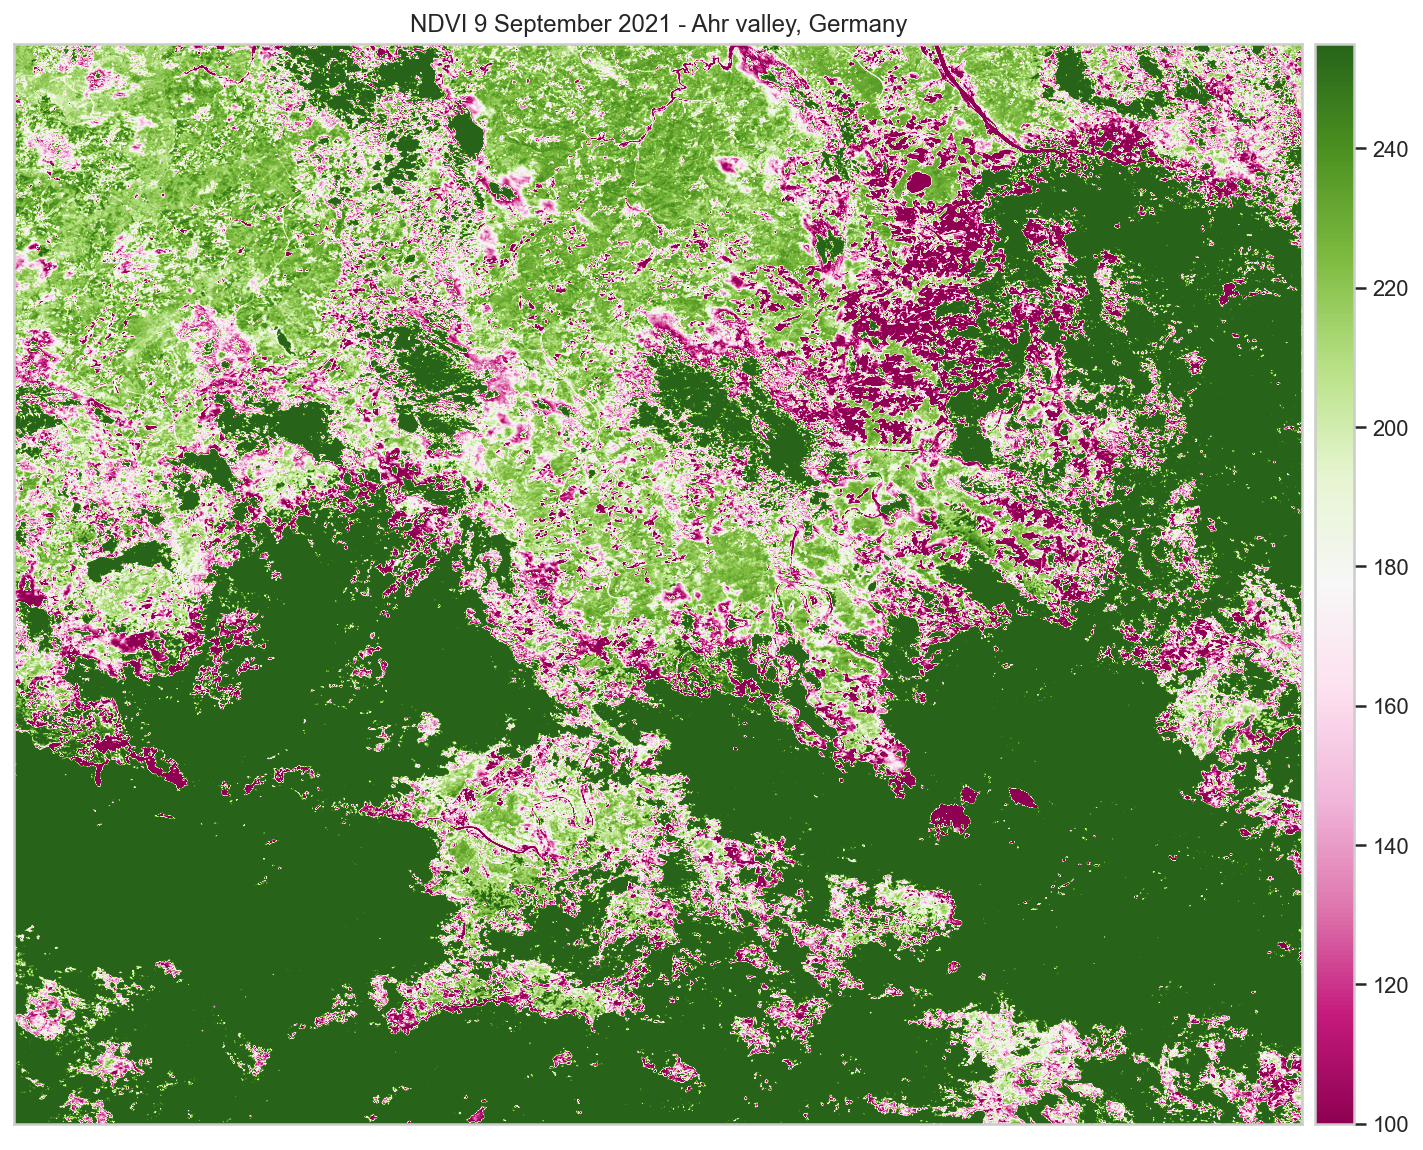
The value 255 is the No data value, and might be indicating a cloud cover, which the preprocessing algo's assign with a 0.
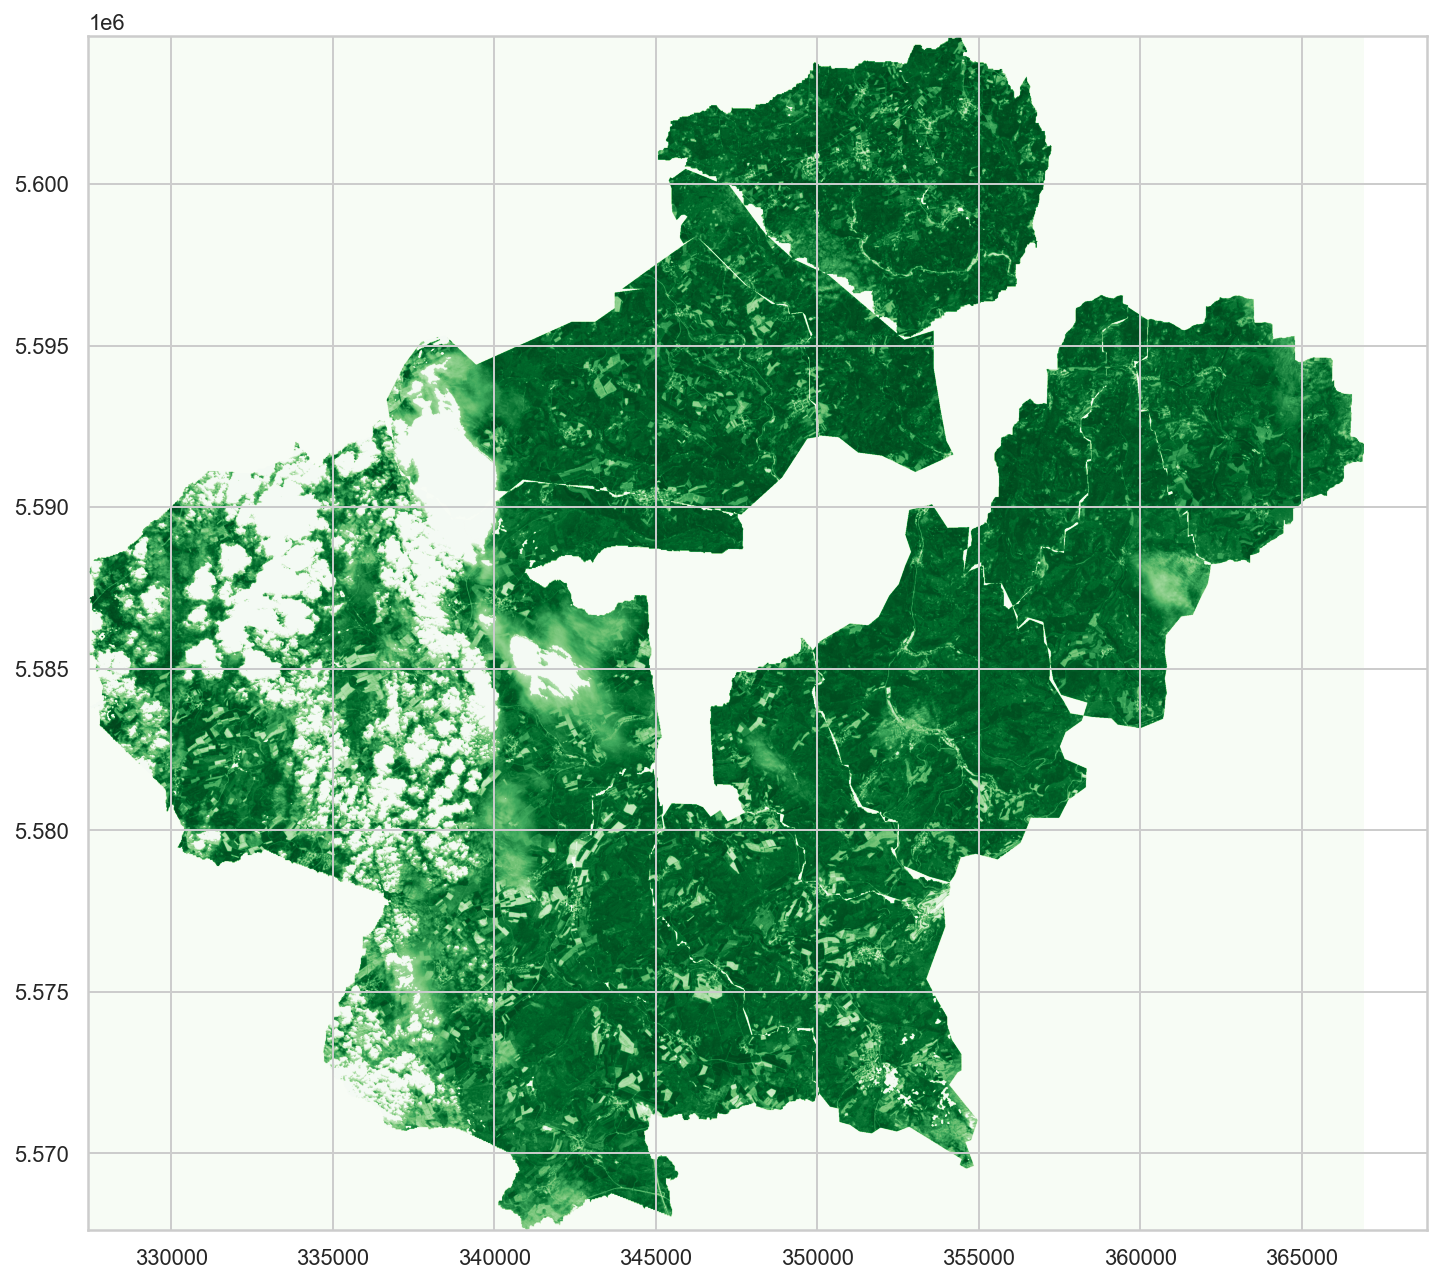
The area of the Upper Ahr was covered with clouds, as well as some parts of the Ansbach and Armuthsbach. So we better leave them out of the vegetation density assessment here.
gdf_nvdi
1.0.11.1 Spectral NVDI histograms of the streams
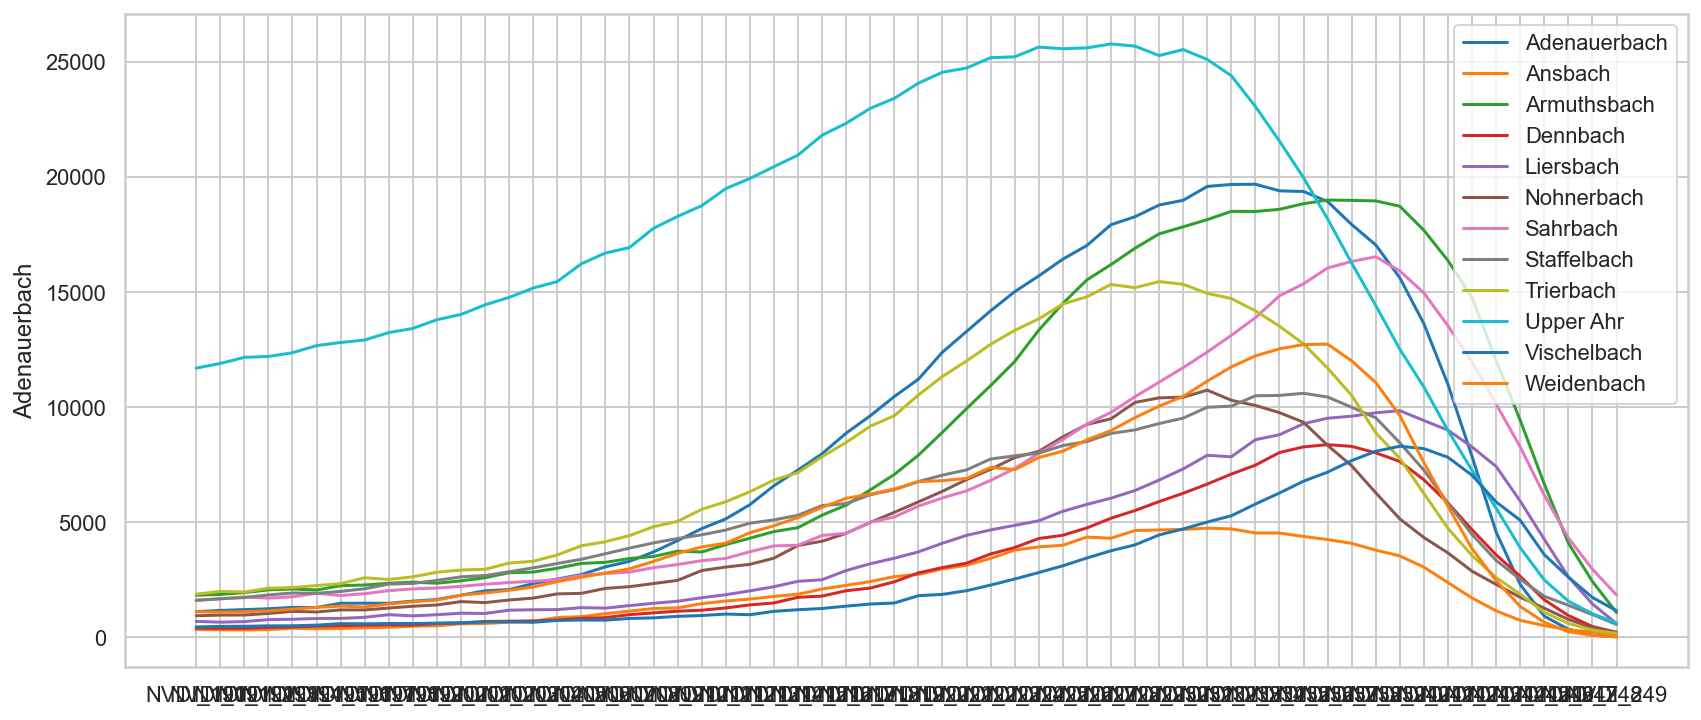
<AxesSubplot:>

<class 'geopandas.geodataframe.GeoDataFrame'>
RangeIndex: 13 entries, 0 to 12
Columns: 255 entries, Name to geometry
dtypes: float64(253), geometry(1), object(1)
memory usage: 26.0+ KB
The conversion between the physical values and digital number, is done by a scale and offset value.
There is also a no data or not valid column.
0          1.0
1       7968.0
2      75977.0
3          1.0
4          0.0
5          0.0
6        154.0
7          0.0
8       6774.0
9     491753.0
10         8.0
11         1.0
12         0.0
Name: NVDI_0, dtype: float64
The percentage of nodata values for each stream.
0     1.76e-04
1     5.73e+00
2     1.17e+01
3     5.24e-04
4     0.00e+00
5     0.00e+00
6     3.35e-02
7     0.00e+00
8     1.24e+00
9     2.42e+01
10    4.25e-03
11    2.69e-04
12    0.00e+00
dtype: float64
'%.5f'
| Name | NVDI_-0.08 | NVDI_-0.076 | NVDI_-0.072 | NVDI_-0.068 | NVDI_-0.064 | NVDI_-0.06 | NVDI_-0.056 | NVDI_-0.052 | NVDI_-0.048 | NVDI_-0.044 | NVDI_-0.04 | NVDI_-0.036 | NVDI_-0.032 | NVDI_-0.028 | NVDI_-0.024 | NVDI_-0.02 | NVDI_-0.016 | NVDI_-0.012 | ... | NVDI_0.876 | NVDI_0.88 | NVDI_0.884 | NVDI_0.888 | NVDI_0.892 | NVDI_0.896 | NVDI_0.9 | NVDI_0.904 | NVDI_0.908 | NVDI_0.912 | NVDI_0.916 | NVDI_0.92 | Pct_090 | Pct_085 | Pct_088 | Pct_0852 | Pct_086 | Pct_084 | geometry | |
|---|---|---|---|---|---|---|---|---|---|---|---|---|---|---|---|---|---|---|---|---|---|---|---|---|---|---|---|---|---|---|---|---|---|---|---|---|---|---|---|
| 0 | Adenauerbach | 1 | 0 | 0 | 0 | 0 | 0 | 0 | 0 | 0 | 1 | 3 | 1 | 1 | 4 | 5 | 5 | 4 | 6 | ... | 17061 | 15630 | 13632 | 10994 | 7859 | 4581 | 2302 | 923 | 357 | 102 | 28 | 10 | 4.05e-03 | 0 | 2.75e-02 | 0 | 3.41e-02 | 0.03 | MULTIPOLYGON (((354088.022 5578396.254, 353454... |
| 1 | Ansbach | 7968 | 0 | 0 | 0 | 0 | 0 | 0 | 0 | 0 | 0 | 0 | 0 | 0 | 0 | 0 | 0 | 0 | 0 | ... | 3794 | 3545 | 3053 | 2383 | 1715 | 1156 | 742 | 516 | 333 | 237 | 135 | 156 | 5.05e-03 | 0 | 2.41e-02 | 0 | 3.09e-02 | 0.03 | MULTIPOLYGON (((340437.976 5590492.134, 340466... |
| 2 | Armuthsbach | 75977 | 0 | 0 | 2 | 0 | 2 | 0 | 0 | 2 | 3 | 1 | 0 | 1 | 1 | 1 | 2 | 1 | 3 | ... | 18977 | 18743 | 17697 | 16379 | 14777 | 12030 | 9438 | 6666 | 4099 | 2430 | 1078 | 669 | 1.30e-02 | 0 | 2.58e-02 | 0 | 2.56e-02 | 0.02 | MULTIPOLYGON (((336666.718 5593327.899, 337209... |
| 3 | Dennbach | 1 | 0 | 0 | 0 | 0 | 0 | 0 | 0 | 0 | 0 | 0 | 0 | 0 | 0 | 0 | 0 | 0 | 0 | ... | 8024 | 7649 | 6852 | 5844 | 4679 | 3589 | 2657 | 1635 | 952 | 475 | 221 | 92 | 1.39e-02 | 0 | 4.00e-02 | 0 | 4.21e-02 | 0.03 | MULTIPOLYGON (((356035.394 5586944.013, 355697... |
| 4 | Liersbach | 0 | 0 | 0 | 0 | 0 | 0 | 0 | 0 | 0 | 0 | 0 | 0 | 0 | 0 | 0 | 0 | 0 | 0 | ... | 9766 | 9857 | 9429 | 9010 | 8279 | 7431 | 5927 | 4263 | 2639 | 1455 | 601 | 320 | 2.25e-02 | 0 | 3.75e-02 | 0 | 3.35e-02 | 0.03 | MULTIPOLYGON (((348243.733 5598632.615, 348420... |
| 5 | Nohnerbach | 0 | 0 | 0 | 0 | 0 | 0 | 0 | 0 | 0 | 0 | 0 | 0 | 0 | 0 | 0 | 0 | 1 | 0 | ... | 6287 | 5152 | 4342 | 3673 | 2878 | 2303 | 1746 | 1272 | 786 | 421 | 183 | 54 | 5.50e-03 | 0 | 1.62e-02 | 0 | 3.08e-02 | 0.03 | MULTIPOLYGON (((343066.104 5581068.545, 343060... |
| 6 | Sahrbach | 154 | 1 | 2 | 2 | 2 | 0 | 3 | 2 | 5 | 1 | 4 | 6 | 3 | 4 | 6 | 6 | 6 | 4 | ... | 16551 | 15932 | 14971 | 13547 | 11966 | 10143 | 8281 | 6181 | 4325 | 2962 | 1848 | 2096 | 1.80e-02 | 0 | 3.46e-02 | 0 | 3.23e-02 | 0.02 | MULTIPOLYGON (((350595.148 5597153.059, 350595... |
| 7 | Staffelbach | 0 | 0 | 0 | 0 | 0 | 0 | 0 | 0 | 0 | 0 | 0 | 0 | 0 | 0 | 0 | 0 | 0 | 0 | ... | 9547 | 8458 | 7269 | 5837 | 4471 | 3347 | 2528 | 1788 | 1398 | 992 | 564 | 467 | 6.84e-03 | 0 | 2.29e-02 | 0 | 2.85e-02 | 0.03 | MULTIPOLYGON (((360764.389 5591179.783, 360762... |
| 8 | Trierbach | 6774 | 2 | 1 | 4 | 2 | 6 | 2 | 5 | 7 | 9 | 10 | 15 | 10 | 9 | 13 | 7 | 10 | 15 | ... | 8895 | 7781 | 6257 | 4740 | 3555 | 2608 | 1878 | 1095 | 609 | 325 | 177 | 53 | 3.39e-03 | 0 | 1.41e-02 | 0 | 2.44e-02 | 0.03 | MULTIPOLYGON (((345215.410 5580426.185, 345481... |
| 9 | Upper Ahr | 491753 | 33 | 31 | 40 | 34 | 38 | 47 | 48 | 51 | 48 | 52 | 73 | 73 | 57 | 75 | 84 | 101 | 103 | ... | 14428 | 12526 | 10884 | 8991 | 7257 | 5617 | 3898 | 2498 | 1577 | 1032 | 625 | 893 | 1.55e-03 | 0 | 4.97e-03 | 0 | 8.55e-03 | 0.01 | MULTIPOLYGON (((346319.429 5571123.271, 346299... |
| 10 | Vischelbach | 8 | 0 | 0 | 0 | 0 | 0 | 0 | 0 | 0 | 0 | 0 | 0 | 0 | 0 | 0 | 0 | 0 | 0 | ... | 8094 | 8312 | 8207 | 7830 | 7048 | 5888 | 5093 | 3600 | 2620 | 1736 | 1161 | 1406 | 2.70e-02 | 0 | 4.41e-02 | 0 | 3.33e-02 | 0.02 | MULTIPOLYGON (((354745.883 5598732.589, 354726... |
| 11 | Weidenbach | 1 | 0 | 0 | 0 | 0 | 0 | 0 | 0 | 1 | 0 | 1 | 0 | 0 | 0 | 1 | 0 | 0 | 0 | ... | 11081 | 9641 | 7599 | 5694 | 3855 | 2463 | 1346 | 659 | 246 | 93 | 21 | 7 | 3.62e-03 | 0 | 2.59e-02 | 0 | 3.37e-02 | 0.03 | MULTIPOLYGON (((358474.215 5583513.930, 358222... |
| 12 | Wirftbach | 0 | 2 | 5 | 6 | 5 | 5 | 5 | 4 | 4 | 3 | 5 | 3 | 8 | 8 | 7 | 9 | 11 | 6 | ... | 4454 | 3852 | 3024 | 2282 | 1746 | 1265 | 971 | 631 | 351 | 167 | 89 | 30 | 3.90e-03 | 0 | 1.55e-02 | 0 | 2.85e-02 | 0.03 | MULTIPOLYGON (((351783.517 5578107.266, 351763... |
13 rows × 259 columns
| NVDI_0.68 | NVDI_0.684 | NVDI_0.688 | NVDI_0.692 | NVDI_0.696 | NVDI_0.7 | NVDI_0.704 | NVDI_0.708 | NVDI_0.712 | NVDI_0.716 | NVDI_0.72 | NVDI_0.724 | NVDI_0.728 | NVDI_0.732 | NVDI_0.736 | NVDI_0.74 | NVDI_0.744 | NVDI_0.748 | NVDI_0.752 | ... | NVDI_0.848 | NVDI_0.852 | NVDI_0.856 | NVDI_0.86 | NVDI_0.864 | NVDI_0.868 | NVDI_0.872 | NVDI_0.876 | NVDI_0.88 | NVDI_0.884 | NVDI_0.888 | NVDI_0.892 | NVDI_0.896 | NVDI_0.9 | NVDI_0.904 | NVDI_0.908 | NVDI_0.912 | NVDI_0.916 | sum | |
|---|---|---|---|---|---|---|---|---|---|---|---|---|---|---|---|---|---|---|---|---|---|---|---|---|---|---|---|---|---|---|---|---|---|---|---|---|---|---|---|
| Name | |||||||||||||||||||||||||||||||||||||||
| Adenauerbach | 1120 | 1176 | 1209 | 1246 | 1308 | 1303 | 1486 | 1488 | 1484 | 1579 | 1649 | 1835 | 2027 | 2080 | 2340 | 2536 | 2734 | 3070 | 3307 | ... | 19606 | 19692 | 19702 | 19414 | 19387 | 18948 | 17948 | 17061 | 15630 | 13632 | 10994 | 7859 | 4581 | 2302 | 923 | 357 | 102 | 28 | 506958 |
| Ansbach | 343 | 332 | 329 | 334 | 403 | 377 | 388 | 420 | 444 | 488 | 506 | 596 | 608 | 663 | 701 | 867 | 903 | 1033 | 1145 | ... | 4751 | 4716 | 4542 | 4537 | 4389 | 4255 | 4091 | 3794 | 3545 | 3053 | 2383 | 1715 | 1156 | 742 | 516 | 333 | 237 | 135 | 126851 |
| Armuthsbach | 1834 | 1871 | 1947 | 2068 | 2106 | 2061 | 2250 | 2279 | 2355 | 2404 | 2356 | 2462 | 2597 | 2812 | 2841 | 3009 | 3217 | 3266 | 3431 | ... | 18163 | 18523 | 18517 | 18611 | 18856 | 19014 | 19000 | 18977 | 18743 | 17697 | 16379 | 14777 | 12030 | 9438 | 6666 | 4099 | 2430 | 1078 | 515103 |
| Dennbach | 410 | 396 | 400 | 434 | 456 | 489 | 508 | 532 | 549 | 538 | 605 | 632 | 694 | 705 | 716 | 758 | 827 | 863 | 990 | ... | 6668 | 7101 | 7490 | 8038 | 8283 | 8381 | 8304 | 8024 | 7649 | 6852 | 5844 | 4679 | 3589 | 2657 | 1635 | 952 | 475 | 221 | 179046 |
| Liersbach | 699 | 664 | 688 | 775 | 790 | 823 | 828 | 874 | 989 | 938 | 987 | 1054 | 1042 | 1184 | 1203 | 1210 | 1296 | 1274 | 1383 | ... | 7917 | 7855 | 8596 | 8812 | 9293 | 9530 | 9619 | 9766 | 9857 | 9429 | 9010 | 8279 | 7431 | 5927 | 4263 | 2639 | 1455 | 601 | 239103 |
| Nohnerbach | 943 | 972 | 974 | 1043 | 1133 | 1107 | 1197 | 1196 | 1277 | 1356 | 1411 | 1558 | 1514 | 1627 | 1711 | 1892 | 1917 | 2133 | 2206 | ... | 10750 | 10310 | 10085 | 9771 | 9353 | 8349 | 7460 | 6287 | 5152 | 4342 | 3673 | 2878 | 2303 | 1746 | 1272 | 786 | 421 | 183 | 263726 |
| Sahrbach | 1616 | 1675 | 1759 | 1708 | 1769 | 1922 | 1821 | 1900 | 2034 | 2107 | 2149 | 2220 | 2312 | 2387 | 2439 | 2513 | 2694 | 2779 | 2842 | ... | 12407 | 13134 | 13900 | 14852 | 15373 | 16061 | 16344 | 16551 | 15932 | 14971 | 13547 | 11966 | 10143 | 8281 | 6181 | 4325 | 2962 | 1848 | 394582 |
| Staffelbach | 1613 | 1682 | 1733 | 1848 | 1933 | 1918 | 1999 | 2117 | 2319 | 2346 | 2480 | 2634 | 2690 | 2855 | 3024 | 3214 | 3398 | 3637 | 3883 | ... | 10007 | 10053 | 10505 | 10520 | 10613 | 10450 | 10004 | 9547 | 8458 | 7269 | 5837 | 4471 | 3347 | 2528 | 1788 | 1398 | 992 | 564 | 321139 |
| Trierbach | 1881 | 1998 | 1976 | 2141 | 2171 | 2255 | 2337 | 2595 | 2519 | 2635 | 2835 | 2931 | 2961 | 3233 | 3311 | 3585 | 3984 | 4160 | 4428 | ... | 14957 | 14734 | 14201 | 13528 | 12762 | 11704 | 10521 | 8895 | 7781 | 6257 | 4740 | 3555 | 2608 | 1878 | 1095 | 609 | 325 | 177 | 425604 |
| Upper Ahr | 11708 | 11910 | 12175 | 12215 | 12376 | 12685 | 12822 | 12930 | 13253 | 13433 | 13811 | 14040 | 14459 | 14781 | 15188 | 15470 | 16246 | 16710 | 16950 | ... | 25126 | 24416 | 23081 | 21574 | 19982 | 18192 | 16271 | 14428 | 12526 | 10884 | 8991 | 7257 | 5617 | 3898 | 2498 | 1577 | 1032 | 625 | 1010614 |
| Vischelbach | 454 | 480 | 484 | 504 | 506 | 534 | 599 | 594 | 605 | 605 | 621 | 630 | 676 | 678 | 658 | 738 | 755 | 751 | 827 | ... | 5016 | 5289 | 5798 | 6280 | 6793 | 7187 | 7688 | 8094 | 8312 | 8207 | 7830 | 7048 | 5888 | 5093 | 3600 | 2620 | 1736 | 1161 | 164848 |
| Weidenbach | 1123 | 1098 | 1121 | 1154 | 1232 | 1305 | 1361 | 1323 | 1454 | 1551 | 1623 | 1838 | 1934 | 2050 | 2190 | 2426 | 2615 | 2798 | 2982 | ... | 11142 | 11760 | 12238 | 12548 | 12732 | 12747 | 12022 | 11081 | 9641 | 7599 | 5694 | 3855 | 2463 | 1346 | 659 | 246 | 93 | 21 | 313837 |
| Wirftbach | 716 | 737 | 763 | 775 | 749 | 861 | 927 | 956 | 991 | 1048 | 1117 | 1154 | 1224 | 1227 | 1407 | 1447 | 1518 | 1622 | 1806 | ... | 7676 | 7468 | 7291 | 7087 | 6497 | 5806 | 5311 | 4454 | 3852 | 3024 | 2282 | 1746 | 1265 | 971 | 631 | 351 | 167 | 89 | 204855 |
13 rows × 61 columns
| NVDI_0.68 | NVDI_0.684 | NVDI_0.688 | NVDI_0.692 | NVDI_0.696 | NVDI_0.7 | NVDI_0.704 | NVDI_0.708 | NVDI_0.712 | NVDI_0.716 | NVDI_0.72 | NVDI_0.724 | NVDI_0.728 | NVDI_0.732 | NVDI_0.736 | NVDI_0.74 | NVDI_0.744 | NVDI_0.748 | NVDI_0.752 | ... | NVDI_0.864 | NVDI_0.868 | NVDI_0.872 | NVDI_0.876 | NVDI_0.88 | NVDI_0.884 | NVDI_0.888 | NVDI_0.892 | NVDI_0.896 | NVDI_0.9 | NVDI_0.904 | NVDI_0.908 | NVDI_0.912 | NVDI_0.916 | sum | Bach | Area | Max_Q | Bache | |
|---|---|---|---|---|---|---|---|---|---|---|---|---|---|---|---|---|---|---|---|---|---|---|---|---|---|---|---|---|---|---|---|---|---|---|---|---|---|---|---|
| Adenauer | 1120 | 1176 | 1209 | 1246 | 1308 | 1303 | 1486 | 1488 | 1484 | 1579 | 1649 | 1835 | 2027 | 2080 | 2340 | 2536 | 2734 | 3070 | 3307 | ... | 19387 | 18948 | 17948 | 17061 | 15630 | 13632 | 10994 | 7859 | 4581 | 2302 | 923 | 357 | 102 | 28 | 506958 | Adenauer | 58.45 | 108.72 | Adenauerbach |
| Ans | 343 | 332 | 329 | 334 | 403 | 377 | 388 | 420 | 444 | 488 | 506 | 596 | 608 | 663 | 701 | 867 | 903 | 1033 | 1145 | ... | 4389 | 4255 | 4091 | 3794 | 3545 | 3053 | 2383 | 1715 | 1156 | 742 | 516 | 333 | 237 | 135 | 126851 | Ans | 15.00 | 41.13 | Ansbach |
| Armuths | 1834 | 1871 | 1947 | 2068 | 2106 | 2061 | 2250 | 2279 | 2355 | 2404 | 2356 | 2462 | 2597 | 2812 | 2841 | 3009 | 3217 | 3266 | 3431 | ... | 18856 | 19014 | 19000 | 18977 | 18743 | 17697 | 16379 | 14777 | 12030 | 9438 | 6666 | 4099 | 2430 | 1078 | 515103 | Armuths | 72.60 | 139.48 | Armuthsbach |
| Denn | 410 | 396 | 400 | 434 | 456 | 489 | 508 | 532 | 549 | 538 | 605 | 632 | 694 | 705 | 716 | 758 | 827 | 863 | 990 | ... | 8283 | 8381 | 8304 | 8024 | 7649 | 6852 | 5844 | 4679 | 3589 | 2657 | 1635 | 952 | 475 | 221 | 179046 | Denn | 20.00 | 46.28 | Dennbach |
| Liers | 699 | 664 | 688 | 775 | 790 | 823 | 828 | 874 | 989 | 938 | 987 | 1054 | 1042 | 1184 | 1203 | 1210 | 1296 | 1274 | 1383 | ... | 9293 | 9530 | 9619 | 9766 | 9857 | 9429 | 9010 | 8279 | 7431 | 5927 | 4263 | 2639 | 1455 | 601 | 239103 | Liers | 28.94 | 77.87 | Liersbach |
| Nohner | 943 | 972 | 974 | 1043 | 1133 | 1107 | 1197 | 1196 | 1277 | 1356 | 1411 | 1558 | 1514 | 1627 | 1711 | 1892 | 1917 | 2133 | 2206 | ... | 9353 | 8349 | 7460 | 6287 | 5152 | 4342 | 3673 | 2878 | 2303 | 1746 | 1272 | 786 | 421 | 183 | 263726 | Nohner | 31.26 | 57.05 | Nohnerbach |
| Sahr | 1616 | 1675 | 1759 | 1708 | 1769 | 1922 | 1821 | 1900 | 2034 | 2107 | 2149 | 2220 | 2312 | 2387 | 2439 | 2513 | 2694 | 2779 | 2842 | ... | 15373 | 16061 | 16344 | 16551 | 15932 | 14971 | 13547 | 11966 | 10143 | 8281 | 6181 | 4325 | 2962 | 1848 | 394582 | Sahr | 45.60 | 86.19 | Sahrbach |
| Staffel | 1613 | 1682 | 1733 | 1848 | 1933 | 1918 | 1999 | 2117 | 2319 | 2346 | 2480 | 2634 | 2690 | 2855 | 3024 | 3214 | 3398 | 3637 | 3883 | ... | 10613 | 10450 | 10004 | 9547 | 8458 | 7269 | 5837 | 4471 | 3347 | 2528 | 1788 | 1398 | 992 | 564 | 321139 | Staffel | 38.00 | 38.12 | Staffelbach |
| Trier | 1881 | 1998 | 1976 | 2141 | 2171 | 2255 | 2337 | 2595 | 2519 | 2635 | 2835 | 2931 | 2961 | 3233 | 3311 | 3585 | 3984 | 4160 | 4428 | ... | 12762 | 11704 | 10521 | 8895 | 7781 | 6257 | 4740 | 3555 | 2608 | 1878 | 1095 | 609 | 325 | 177 | 425604 | Trier | 55.06 | 84.78 | Trierbach |
| Vischel | 454 | 480 | 484 | 504 | 506 | 534 | 599 | 594 | 605 | 605 | 621 | 630 | 676 | 678 | 658 | 738 | 755 | 751 | 827 | ... | 6793 | 7187 | 7688 | 8094 | 8312 | 8207 | 7830 | 7048 | 5888 | 5093 | 3600 | 2620 | 1736 | 1161 | 164848 | Vischel | 20.70 | 40.00 | Vischelbach |
| Weiden | 1123 | 1098 | 1121 | 1154 | 1232 | 1305 | 1361 | 1323 | 1454 | 1551 | 1623 | 1838 | 1934 | 2050 | 2190 | 2426 | 2615 | 2798 | 2982 | ... | 12732 | 12747 | 12022 | 11081 | 9641 | 7599 | 5694 | 3855 | 2463 | 1346 | 659 | 246 | 93 | 21 | 313837 | Weiden | 37.90 | 77.85 | Weidenbach |
| Wirft | 716 | 737 | 763 | 775 | 749 | 861 | 927 | 956 | 991 | 1048 | 1117 | 1154 | 1224 | 1227 | 1407 | 1447 | 1518 | 1622 | 1806 | ... | 6497 | 5806 | 5311 | 4454 | 3852 | 3024 | 2282 | 1746 | 1265 | 971 | 631 | 351 | 167 | 89 | 204855 | Wirft | 25.20 | 41.57 | Wirftbach |
12 rows × 65 columns
<AxesSubplot:xlabel='Area', ylabel='sum'>
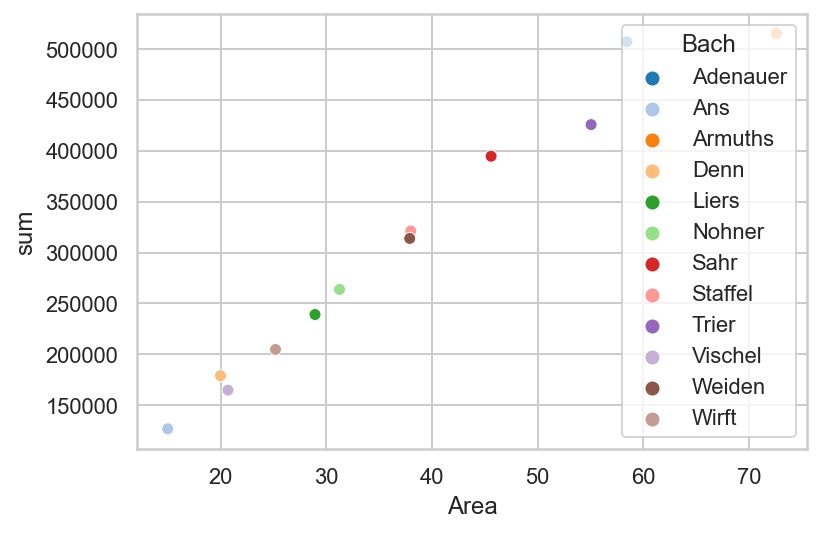
| NVDI_0.76 | NVDI_0.764 | NVDI_0.768 | NVDI_0.772 | NVDI_0.776 | NVDI_0.78 | NVDI_0.784 | NVDI_0.788 | NVDI_0.792 | NVDI_0.796 | NVDI_0.8 | NVDI_0.804 | NVDI_0.808 | NVDI_0.812 | NVDI_0.816 | NVDI_0.82 | NVDI_0.824 | NVDI_0.828 | NVDI_0.832 | ... | NVDI_0.848 | NVDI_0.852 | NVDI_0.856 | NVDI_0.86 | NVDI_0.864 | NVDI_0.868 | NVDI_0.872 | NVDI_0.876 | NVDI_0.88 | NVDI_0.884 | NVDI_0.888 | NVDI_0.892 | NVDI_0.896 | NVDI_0.9 | NVDI_0.904 | NVDI_0.908 | NVDI_0.912 | NVDI_0.916 | sum | |
|---|---|---|---|---|---|---|---|---|---|---|---|---|---|---|---|---|---|---|---|---|---|---|---|---|---|---|---|---|---|---|---|---|---|---|---|---|---|---|---|
| Name | |||||||||||||||||||||||||||||||||||||||
| Adenauerbach | 4210 | 4730 | 5154 | 5771 | 6596 | 7279 | 7986 | 8881 | 9634 | 10471 | 11224 | 12402 | 13300 | 14199 | 15030 | 15715 | 16444 | 17039 | 17941 | ... | 19606 | 19692 | 19702 | 19414 | 19387 | 18948 | 17948 | 17061 | 15630 | 13632 | 10994 | 7859 | 4581 | 2302 | 923 | 357 | 102 | 28 | 468263 |
| Ansbach | 1284 | 1470 | 1581 | 1669 | 1782 | 1879 | 2104 | 2263 | 2425 | 2644 | 2740 | 2980 | 3137 | 3436 | 3795 | 3936 | 4007 | 4363 | 4313 | ... | 4751 | 4716 | 4542 | 4537 | 4389 | 4255 | 4091 | 3794 | 3545 | 3053 | 2383 | 1715 | 1156 | 742 | 516 | 333 | 237 | 135 | 114713 |
| Armuthsbach | 3749 | 3714 | 4034 | 4313 | 4601 | 4773 | 5316 | 5751 | 6414 | 7084 | 7921 | 8920 | 9947 | 10947 | 11994 | 13358 | 14517 | 15545 | 16208 | ... | 18163 | 18523 | 18517 | 18611 | 18856 | 19014 | 19000 | 18977 | 18743 | 17697 | 16379 | 14777 | 12030 | 9438 | 6666 | 4099 | 2430 | 1078 | 464418 |
| Dennbach | 1142 | 1182 | 1282 | 1413 | 1499 | 1743 | 1797 | 2030 | 2146 | 2417 | 2806 | 3036 | 3229 | 3629 | 3908 | 4300 | 4441 | 4761 | 5182 | ... | 6668 | 7101 | 7490 | 8038 | 8283 | 8381 | 8304 | 8024 | 7649 | 6852 | 5844 | 4679 | 3589 | 2657 | 1635 | 952 | 475 | 221 | 166475 |
| Liersbach | 1573 | 1726 | 1857 | 2024 | 2206 | 2440 | 2508 | 2909 | 3204 | 3444 | 3719 | 4095 | 4436 | 4674 | 4873 | 5072 | 5483 | 5783 | 6054 | ... | 7917 | 7855 | 8596 | 8812 | 9293 | 9530 | 9619 | 9766 | 9857 | 9429 | 9010 | 8279 | 7431 | 5927 | 4263 | 2639 | 1455 | 601 | 218916 |
| Nohnerbach | 2481 | 2909 | 3060 | 3177 | 3447 | 3997 | 4183 | 4523 | 4999 | 5438 | 5892 | 6353 | 6861 | 7307 | 7819 | 8088 | 8718 | 9260 | 9504 | ... | 10750 | 10310 | 10085 | 9771 | 9353 | 8349 | 7460 | 6287 | 5152 | 4342 | 3673 | 2878 | 2303 | 1746 | 1272 | 786 | 421 | 183 | 234216 |
| Sahrbach | 3169 | 3336 | 3437 | 3726 | 3980 | 4004 | 4433 | 4527 | 5011 | 5236 | 5708 | 6065 | 6372 | 6828 | 7338 | 8005 | 8603 | 9271 | 9786 | ... | 12407 | 13134 | 13900 | 14852 | 15373 | 16061 | 16344 | 16551 | 15932 | 14971 | 13547 | 11966 | 10143 | 8281 | 6181 | 4325 | 2962 | 1848 | 350904 |
| Staffelbach | 4299 | 4461 | 4670 | 4965 | 5109 | 5311 | 5733 | 5819 | 6202 | 6425 | 6778 | 7055 | 7282 | 7758 | 7894 | 8011 | 8341 | 8518 | 8868 | ... | 10007 | 10053 | 10505 | 10520 | 10613 | 10450 | 10004 | 9547 | 8458 | 7269 | 5837 | 4471 | 3347 | 2528 | 1788 | 1398 | 992 | 564 | 269706 |
| Trierbach | 5048 | 5569 | 5898 | 6333 | 6843 | 7167 | 7858 | 8478 | 9180 | 9637 | 10541 | 11345 | 12019 | 12742 | 13349 | 13848 | 14495 | 14807 | 15345 | ... | 14957 | 14734 | 14201 | 13528 | 12762 | 11704 | 10521 | 8895 | 7781 | 6257 | 4740 | 3555 | 2608 | 1878 | 1095 | 609 | 325 | 177 | 366855 |
| Upper Ahr | 18304 | 18766 | 19514 | 19951 | 20463 | 20970 | 21832 | 22352 | 22999 | 23435 | 24094 | 24571 | 24752 | 25204 | 25240 | 25664 | 25591 | 25630 | 25801 | ... | 25126 | 24416 | 23081 | 21574 | 19982 | 18192 | 16271 | 14428 | 12526 | 10884 | 8991 | 7257 | 5617 | 3898 | 2498 | 1577 | 1032 | 625 | 729664 |
| Vischelbach | 916 | 953 | 1016 | 987 | 1134 | 1205 | 1259 | 1359 | 1452 | 1496 | 1814 | 1871 | 2032 | 2275 | 2540 | 2820 | 3114 | 3454 | 3767 | ... | 5016 | 5289 | 5798 | 6280 | 6793 | 7187 | 7688 | 8094 | 8312 | 8207 | 7830 | 7048 | 5888 | 5093 | 3600 | 2620 | 1736 | 1161 | 152299 |
| Weidenbach | 3653 | 3934 | 4098 | 4554 | 4854 | 5208 | 5656 | 6049 | 6232 | 6452 | 6771 | 6817 | 6913 | 7392 | 7296 | 7820 | 8095 | 8589 | 8995 | ... | 11142 | 11760 | 12238 | 12548 | 12732 | 12747 | 12022 | 11081 | 9641 | 7599 | 5694 | 3855 | 2463 | 1346 | 659 | 246 | 93 | 21 | 277354 |
| Wirftbach | 2048 | 2274 | 2509 | 2679 | 3011 | 3338 | 3726 | 4048 | 4489 | 4691 | 5242 | 5598 | 6036 | 6340 | 6802 | 6977 | 7305 | 7524 | 7835 | ... | 7676 | 7468 | 7291 | 7087 | 6497 | 5806 | 5311 | 4454 | 3852 | 3024 | 2282 | 1746 | 1265 | 971 | 631 | 351 | 167 | 89 | 181923 |
13 rows × 41 columns
| NVDI_0.76 | NVDI_0.764 | NVDI_0.768 | NVDI_0.772 | NVDI_0.776 | NVDI_0.78 | NVDI_0.784 | NVDI_0.788 | NVDI_0.792 | NVDI_0.796 | NVDI_0.8 | NVDI_0.804 | NVDI_0.808 | NVDI_0.812 | NVDI_0.816 | NVDI_0.82 | NVDI_0.824 | NVDI_0.828 | NVDI_0.832 | ... | NVDI_0.864 | NVDI_0.868 | NVDI_0.872 | NVDI_0.876 | NVDI_0.88 | NVDI_0.884 | NVDI_0.888 | NVDI_0.892 | NVDI_0.896 | NVDI_0.9 | NVDI_0.904 | NVDI_0.908 | NVDI_0.912 | NVDI_0.916 | sum | Bach | Area | Max_Q | Bache | |
|---|---|---|---|---|---|---|---|---|---|---|---|---|---|---|---|---|---|---|---|---|---|---|---|---|---|---|---|---|---|---|---|---|---|---|---|---|---|---|---|
| Adenauer | 4210 | 4730 | 5154 | 5771 | 6596 | 7279 | 7986 | 8881 | 9634 | 10471 | 11224 | 12402 | 13300 | 14199 | 15030 | 15715 | 16444 | 17039 | 17941 | ... | 19387 | 18948 | 17948 | 17061 | 15630 | 13632 | 10994 | 7859 | 4581 | 2302 | 923 | 357 | 102 | 28 | 468263 | Adenauer | 58.45 | 108.72 | Adenauerbach |
| Ans | 1284 | 1470 | 1581 | 1669 | 1782 | 1879 | 2104 | 2263 | 2425 | 2644 | 2740 | 2980 | 3137 | 3436 | 3795 | 3936 | 4007 | 4363 | 4313 | ... | 4389 | 4255 | 4091 | 3794 | 3545 | 3053 | 2383 | 1715 | 1156 | 742 | 516 | 333 | 237 | 135 | 114713 | Ans | 15.00 | 41.13 | Ansbach |
| Armuths | 3749 | 3714 | 4034 | 4313 | 4601 | 4773 | 5316 | 5751 | 6414 | 7084 | 7921 | 8920 | 9947 | 10947 | 11994 | 13358 | 14517 | 15545 | 16208 | ... | 18856 | 19014 | 19000 | 18977 | 18743 | 17697 | 16379 | 14777 | 12030 | 9438 | 6666 | 4099 | 2430 | 1078 | 464418 | Armuths | 72.60 | 139.48 | Armuthsbach |
| Denn | 1142 | 1182 | 1282 | 1413 | 1499 | 1743 | 1797 | 2030 | 2146 | 2417 | 2806 | 3036 | 3229 | 3629 | 3908 | 4300 | 4441 | 4761 | 5182 | ... | 8283 | 8381 | 8304 | 8024 | 7649 | 6852 | 5844 | 4679 | 3589 | 2657 | 1635 | 952 | 475 | 221 | 166475 | Denn | 20.00 | 46.28 | Dennbach |
| Liers | 1573 | 1726 | 1857 | 2024 | 2206 | 2440 | 2508 | 2909 | 3204 | 3444 | 3719 | 4095 | 4436 | 4674 | 4873 | 5072 | 5483 | 5783 | 6054 | ... | 9293 | 9530 | 9619 | 9766 | 9857 | 9429 | 9010 | 8279 | 7431 | 5927 | 4263 | 2639 | 1455 | 601 | 218916 | Liers | 28.94 | 77.87 | Liersbach |
| Nohner | 2481 | 2909 | 3060 | 3177 | 3447 | 3997 | 4183 | 4523 | 4999 | 5438 | 5892 | 6353 | 6861 | 7307 | 7819 | 8088 | 8718 | 9260 | 9504 | ... | 9353 | 8349 | 7460 | 6287 | 5152 | 4342 | 3673 | 2878 | 2303 | 1746 | 1272 | 786 | 421 | 183 | 234216 | Nohner | 31.26 | 57.05 | Nohnerbach |
| Sahr | 3169 | 3336 | 3437 | 3726 | 3980 | 4004 | 4433 | 4527 | 5011 | 5236 | 5708 | 6065 | 6372 | 6828 | 7338 | 8005 | 8603 | 9271 | 9786 | ... | 15373 | 16061 | 16344 | 16551 | 15932 | 14971 | 13547 | 11966 | 10143 | 8281 | 6181 | 4325 | 2962 | 1848 | 350904 | Sahr | 45.60 | 86.19 | Sahrbach |
| Staffel | 4299 | 4461 | 4670 | 4965 | 5109 | 5311 | 5733 | 5819 | 6202 | 6425 | 6778 | 7055 | 7282 | 7758 | 7894 | 8011 | 8341 | 8518 | 8868 | ... | 10613 | 10450 | 10004 | 9547 | 8458 | 7269 | 5837 | 4471 | 3347 | 2528 | 1788 | 1398 | 992 | 564 | 269706 | Staffel | 38.00 | 38.12 | Staffelbach |
| Trier | 5048 | 5569 | 5898 | 6333 | 6843 | 7167 | 7858 | 8478 | 9180 | 9637 | 10541 | 11345 | 12019 | 12742 | 13349 | 13848 | 14495 | 14807 | 15345 | ... | 12762 | 11704 | 10521 | 8895 | 7781 | 6257 | 4740 | 3555 | 2608 | 1878 | 1095 | 609 | 325 | 177 | 366855 | Trier | 55.06 | 84.78 | Trierbach |
| Vischel | 916 | 953 | 1016 | 987 | 1134 | 1205 | 1259 | 1359 | 1452 | 1496 | 1814 | 1871 | 2032 | 2275 | 2540 | 2820 | 3114 | 3454 | 3767 | ... | 6793 | 7187 | 7688 | 8094 | 8312 | 8207 | 7830 | 7048 | 5888 | 5093 | 3600 | 2620 | 1736 | 1161 | 152299 | Vischel | 20.70 | 40.00 | Vischelbach |
| Weiden | 3653 | 3934 | 4098 | 4554 | 4854 | 5208 | 5656 | 6049 | 6232 | 6452 | 6771 | 6817 | 6913 | 7392 | 7296 | 7820 | 8095 | 8589 | 8995 | ... | 12732 | 12747 | 12022 | 11081 | 9641 | 7599 | 5694 | 3855 | 2463 | 1346 | 659 | 246 | 93 | 21 | 277354 | Weiden | 37.90 | 77.85 | Weidenbach |
| Wirft | 2048 | 2274 | 2509 | 2679 | 3011 | 3338 | 3726 | 4048 | 4489 | 4691 | 5242 | 5598 | 6036 | 6340 | 6802 | 6977 | 7305 | 7524 | 7835 | ... | 6497 | 5806 | 5311 | 4454 | 3852 | 3024 | 2282 | 1746 | 1265 | 971 | 631 | 351 | 167 | 89 | 181923 | Wirft | 25.20 | 41.57 | Wirftbach |
12 rows × 45 columns
<AxesSubplot:xlabel='Area', ylabel='sum'>

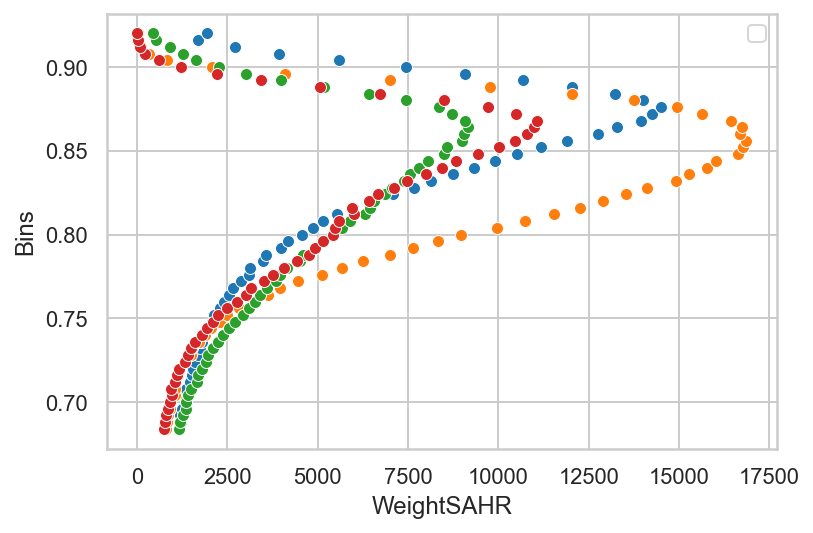
The NDVI has values in the range -0,08 (=no data) and 0,92, but the raster contains values from 0 to 255. So, after rescaling the values of the NDVI-band:
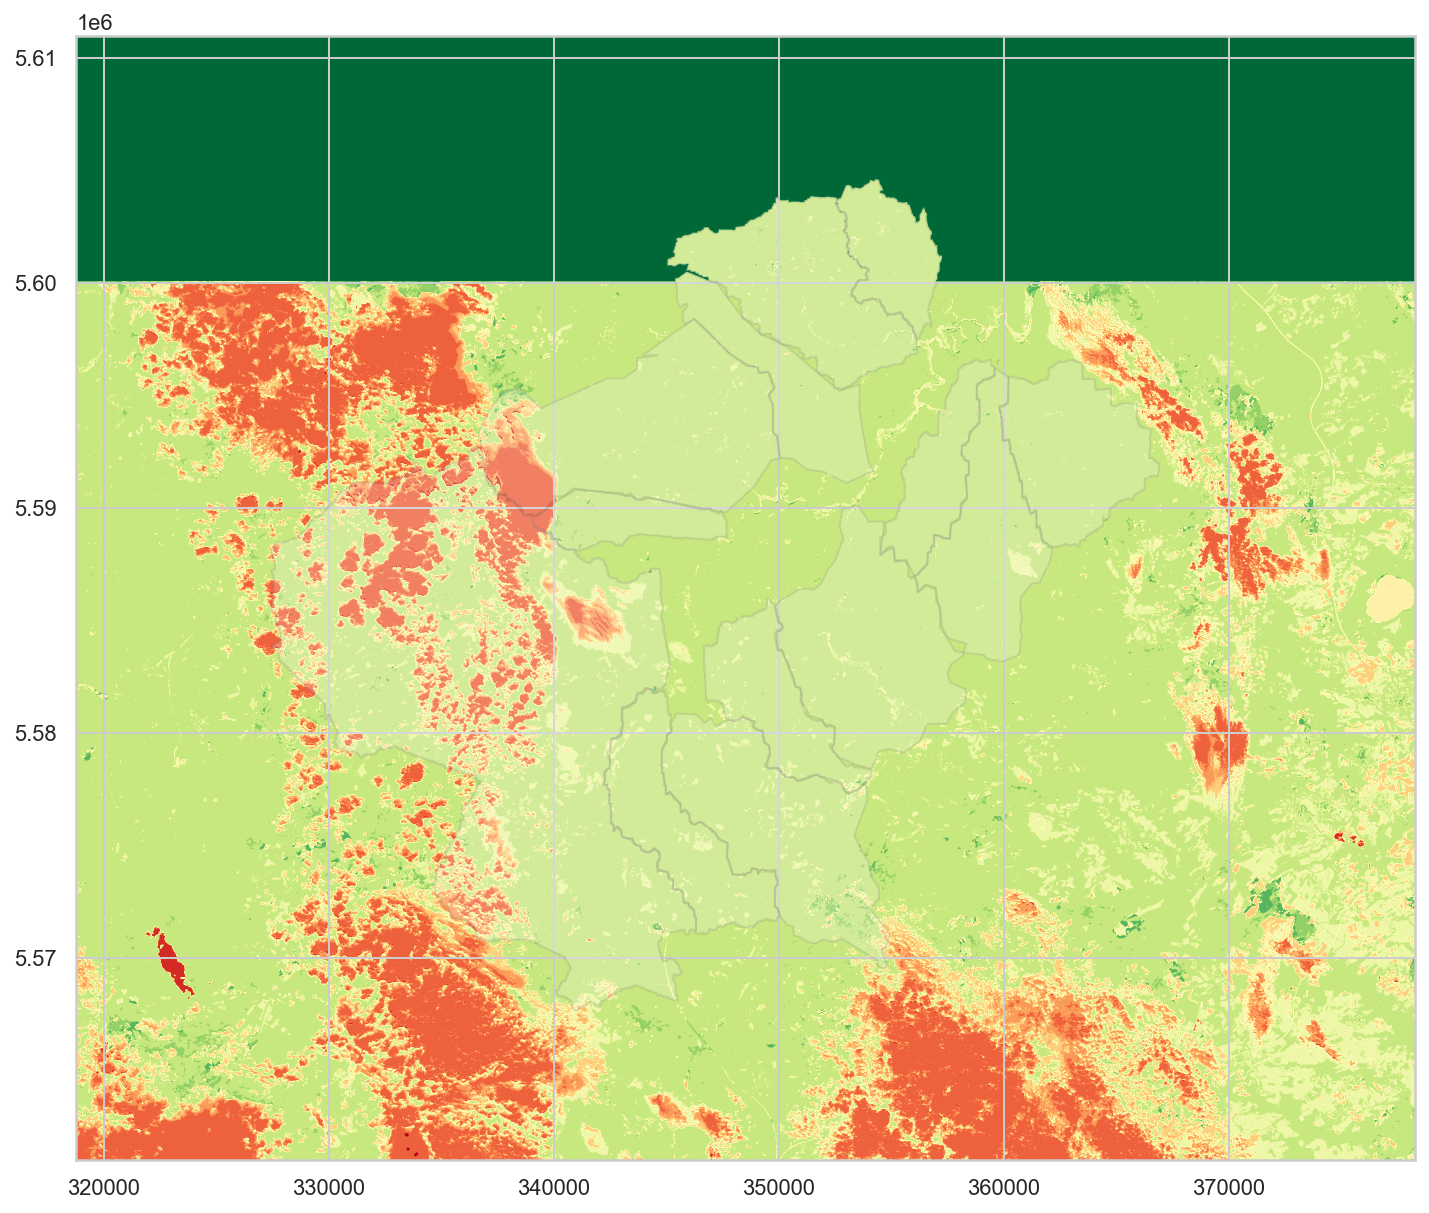
I didn't merge the complete classification rasters of 10 m resolution, due to their size, but I did merge the value rasters.
5610940.0
<open DatasetReader name='P:/Tiles/terrascope_20211228_NVDI/Sentinel2/NDVI_V2/2021/09/09/S2A_20210909T104021_32ULA_NDVI_V200/S2A_20210909T104021_32ULAB_SCENECLASSIFICATION_20M_merged.tif' mode='r'>
<matplotlib.legend.Legend at 0x250465d6430>
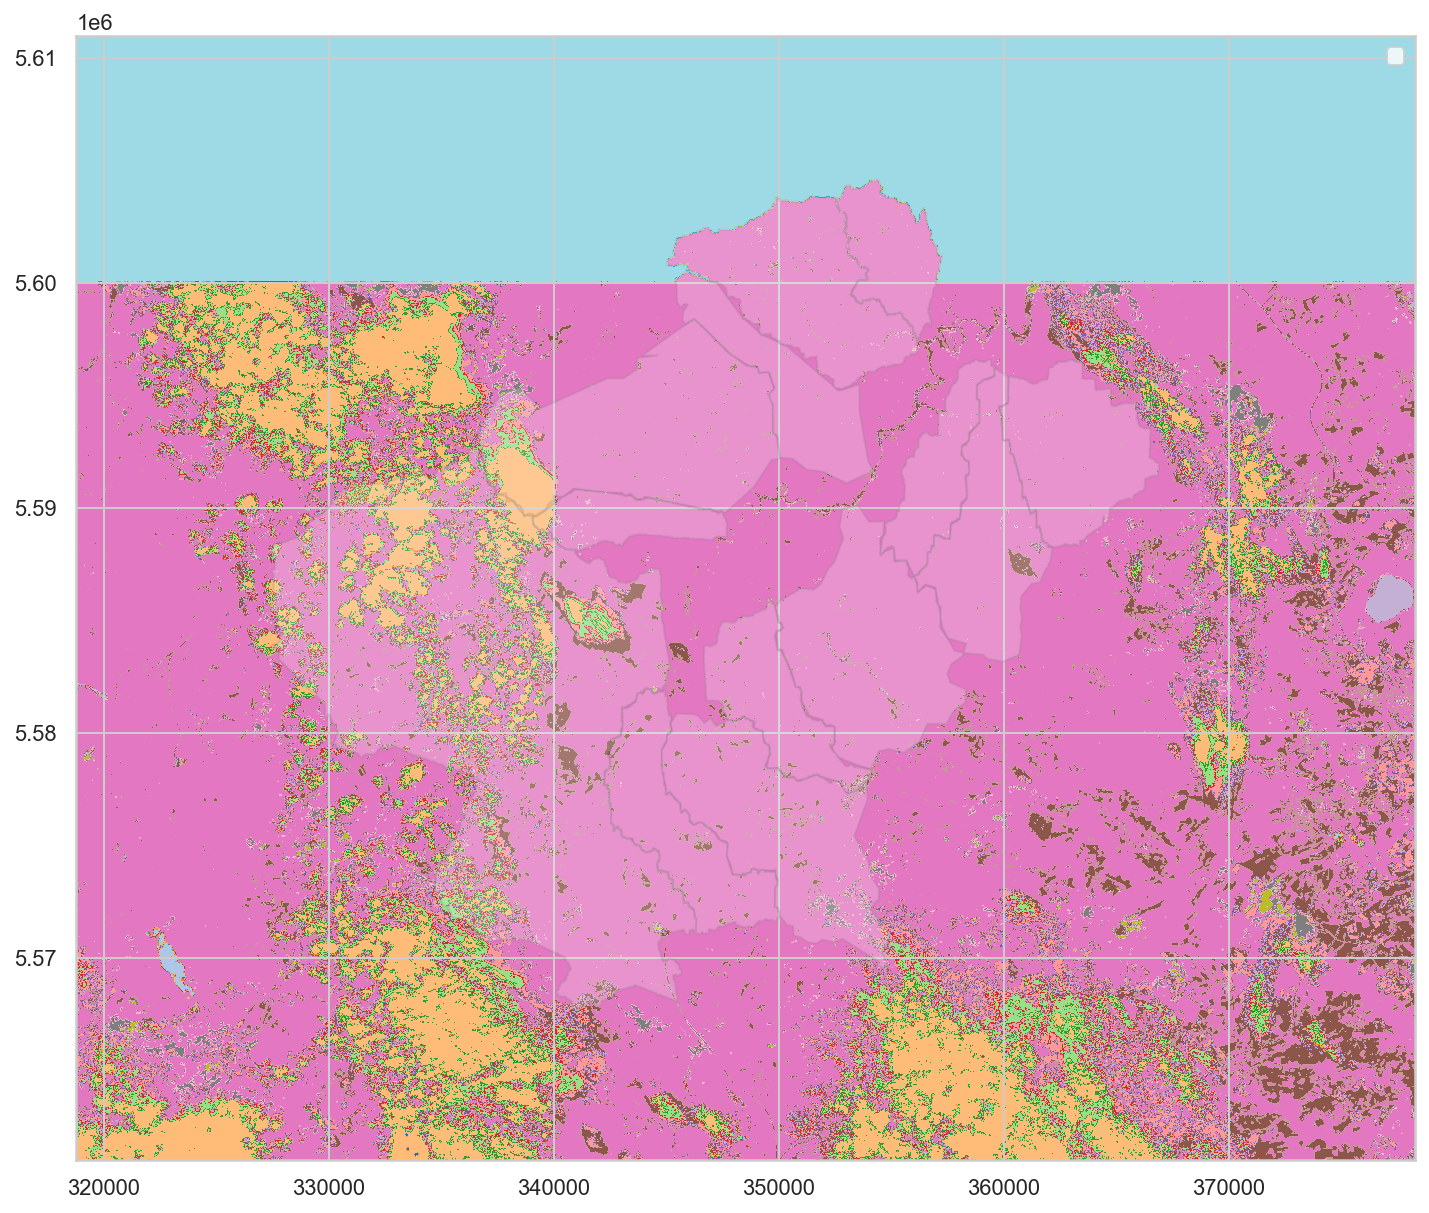
Index(['Name', 'NVDI_0', 'NVDI_1', 'NVDI_2', 'NVDI_3', 'NVDI_4', 'NVDI_5',
       'NVDI_6', 'NVDI_7', 'NVDI_8',
       ...
       'NVDI_244', 'NVDI_245', 'NVDI_246', 'NVDI_247', 'NVDI_248', 'NVDI_249',
       'NVDI_250', 'top_nvdi', 'top_area', 'geometry'],
      dtype='object', length=255)
1.0.11.2 NVDI index at 90,88, 86 and 84%
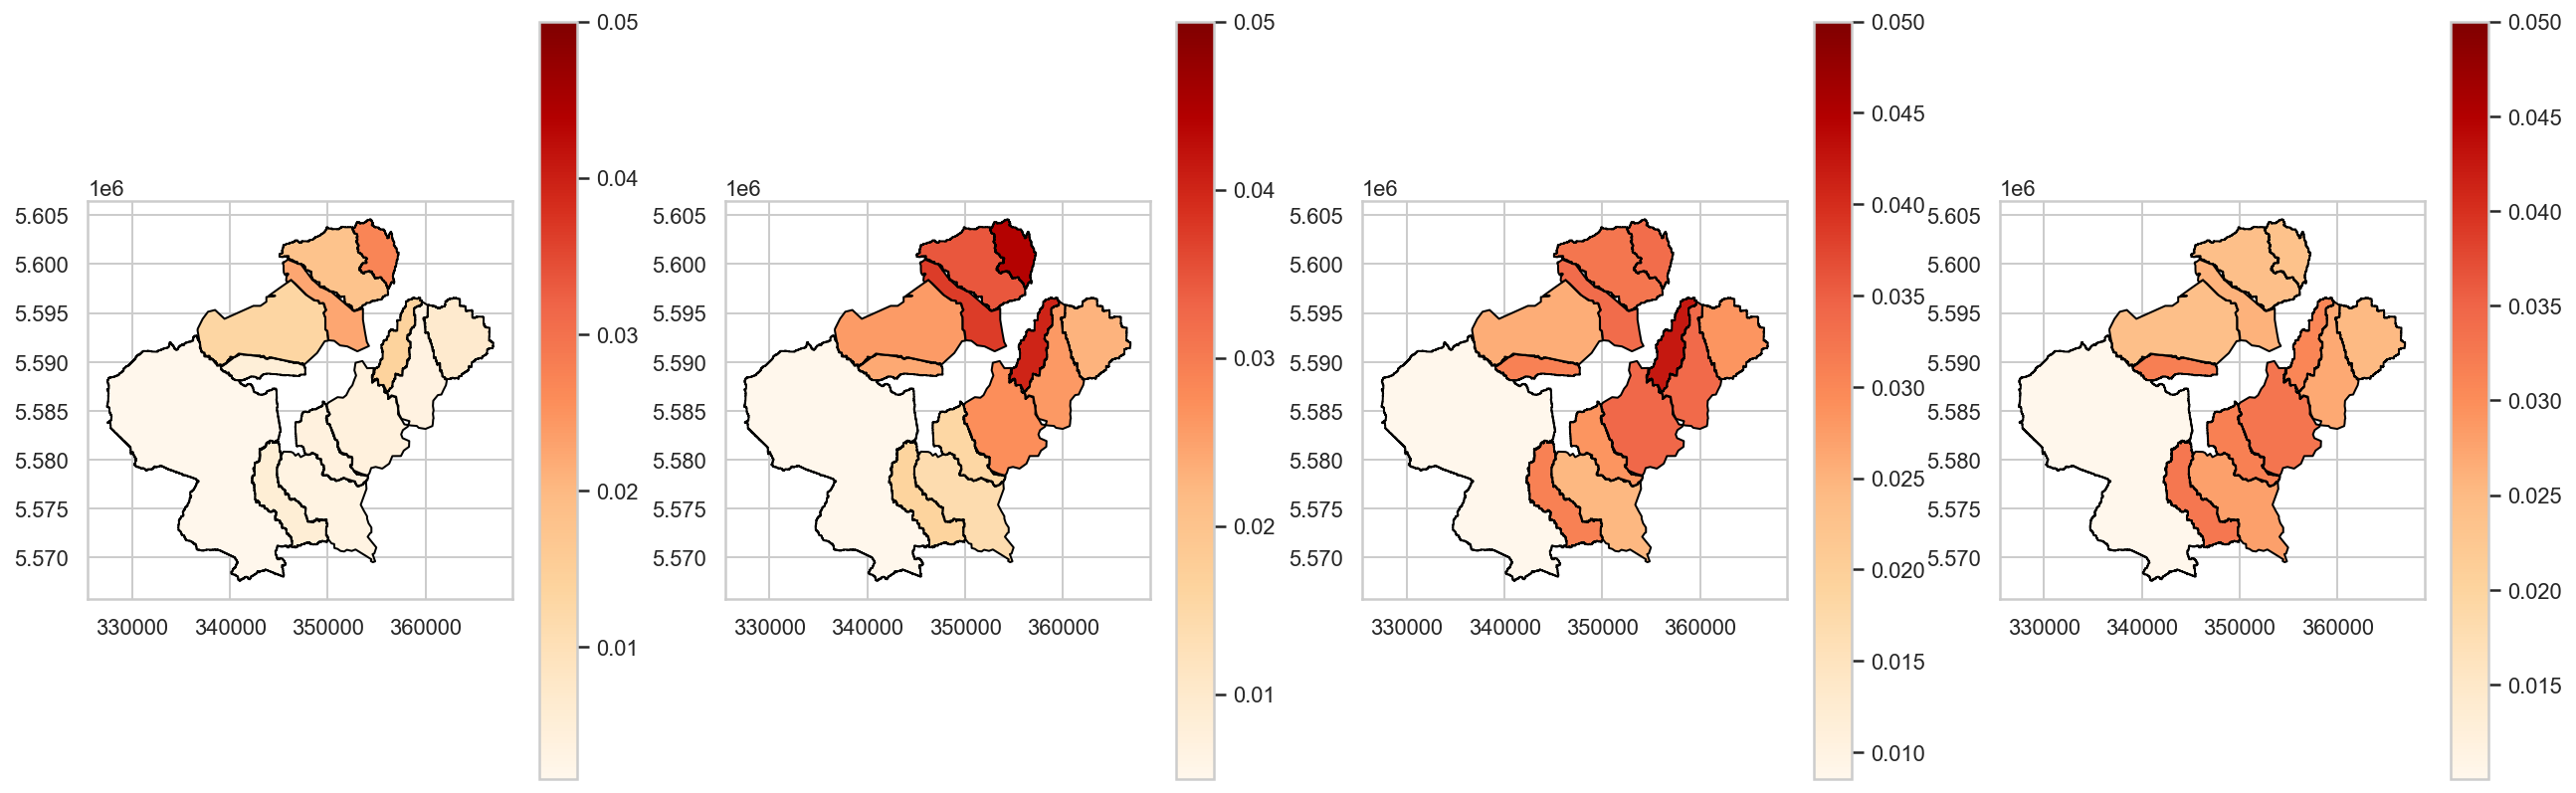
<AxesSubplot:xlabel='Pct_sum', ylabel='Name'>
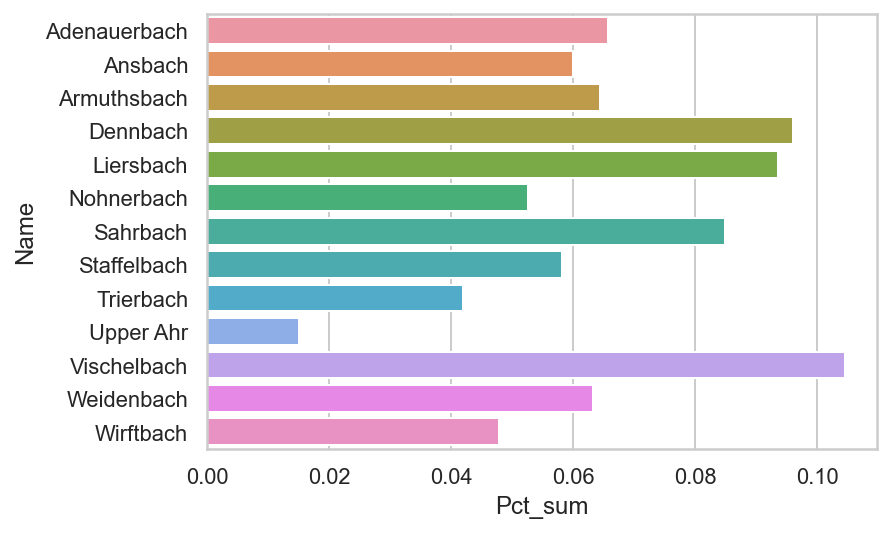
c:\program files\python38\lib\site-packages\geopandas\geodataframe.py:1351: SettingWithCopyWarning:
A value is trying to be set on a copy of a slice from a DataFrame.
Try using .loc[row_indexer,col_indexer] = value instead

See the caveats in the documentation: https://pandas.pydata.org/pandas-docs/stable/user_guide/indexing.html#returning-a-view-versus-a-copy
  super().__setitem__(key, value)
<AxesSubplot:xlabel='Pct_sum', ylabel='Name'>
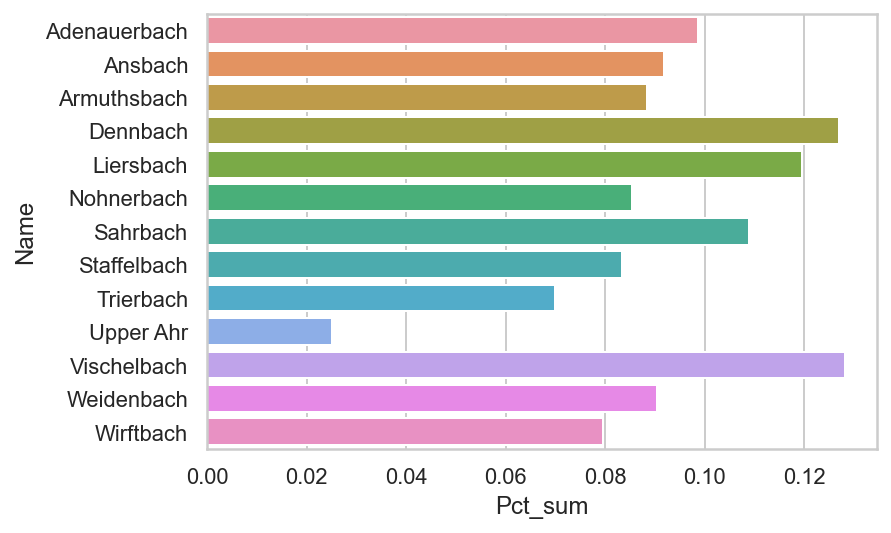
| Name | NVDI_0 | NVDI_1 | NVDI_2 | NVDI_3 | NVDI_4 | NVDI_5 | NVDI_6 | NVDI_7 | NVDI_8 | NVDI_9 | NVDI_10 | NVDI_11 | NVDI_12 | NVDI_13 | NVDI_14 | NVDI_15 | NVDI_16 | NVDI_17 | ... | NVDI_235 | NVDI_236 | NVDI_237 | NVDI_238 | NVDI_239 | NVDI_240 | NVDI_241 | NVDI_242 | NVDI_243 | NVDI_244 | NVDI_245 | NVDI_246 | NVDI_247 | NVDI_248 | NVDI_249 | NVDI_250 | top_nvdi | top_area | geometry | |
|---|---|---|---|---|---|---|---|---|---|---|---|---|---|---|---|---|---|---|---|---|---|---|---|---|---|---|---|---|---|---|---|---|---|---|---|---|---|---|---|
| 0 | Adenauerbach | 1.0 | 0.0 | 0.0 | 0.0 | 0.0 | 0.0 | 0.0 | 0.0 | 0.0 | 1.0 | 3.0 | 1.0 | 1.0 | 4.0 | 5.0 | 5.0 | 4.0 | 6.0 | ... | 19414.0 | 19387.0 | 18948.0 | 17948.0 | 17061.0 | 15630.0 | 13632.0 | 10994.0 | 7859.0 | 4581.0 | 2302.0 | 923.0 | 357.0 | 102.0 | 28.0 | 10.0 | 13252.03 | 0.23 | POLYGON ((354088.022 5578396.254, 353454.423 5... |
1 rows × 255 columns
1.0.11.3 Check increasing non-linearity of NVDI and LAI with combination raster
1.1 Correlation of land use versus maximum outflow and surface area.
In a second study phase I'll add the rainfall amounts.
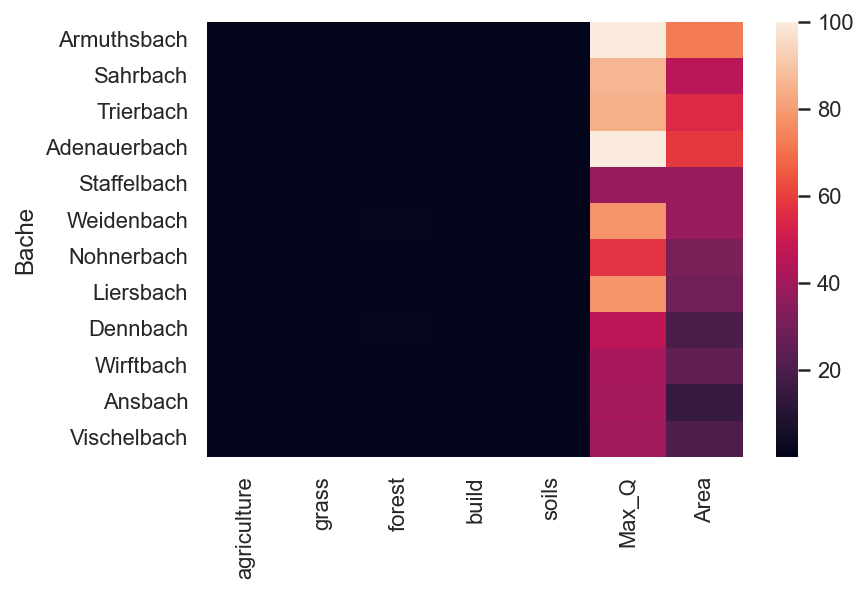
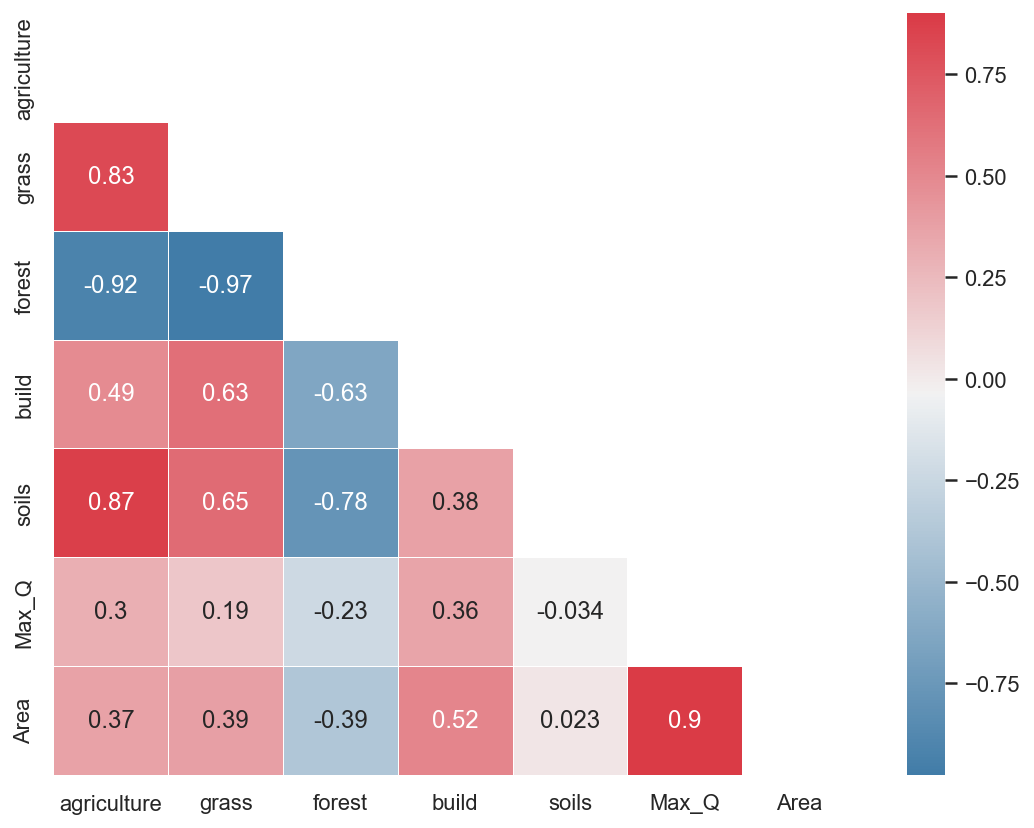
| agriculture | grass | forest | build | soils | Max_Q | Area | |
|---|---|---|---|---|---|---|---|
| count | 1.20e+01 | 12.00 | 12.00 | 1.20e+01 | 1.20e+01 | 12.00 | 12.00 |
| mean | 6.55e-02 | 0.25 | 0.65 | 2.03e-02 | 1.07e-02 | 69.92 | 37.39 |
| std | 5.05e-02 | 0.08 | 0.13 | 1.25e-02 | 5.39e-03 | 31.94 | 17.59 |
| min | 3.30e-03 | 0.08 | 0.47 | 6.26e-03 | 4.95e-03 | 38.12 | 15.00 |
| 25% | 2.85e-02 | 0.21 | 0.54 | 1.04e-02 | 6.22e-03 | 41.46 | 24.07 |
| 50% | 4.80e-02 | 0.26 | 0.65 | 1.70e-02 | 9.52e-03 | 67.45 | 34.58 |
| 75% | 1.01e-01 | 0.31 | 0.73 | 2.78e-02 | 1.35e-02 | 85.14 | 47.97 |
| max | 1.52e-01 | 0.36 | 0.91 | 4.34e-02 | 2.27e-02 | 139.48 | 72.60 |
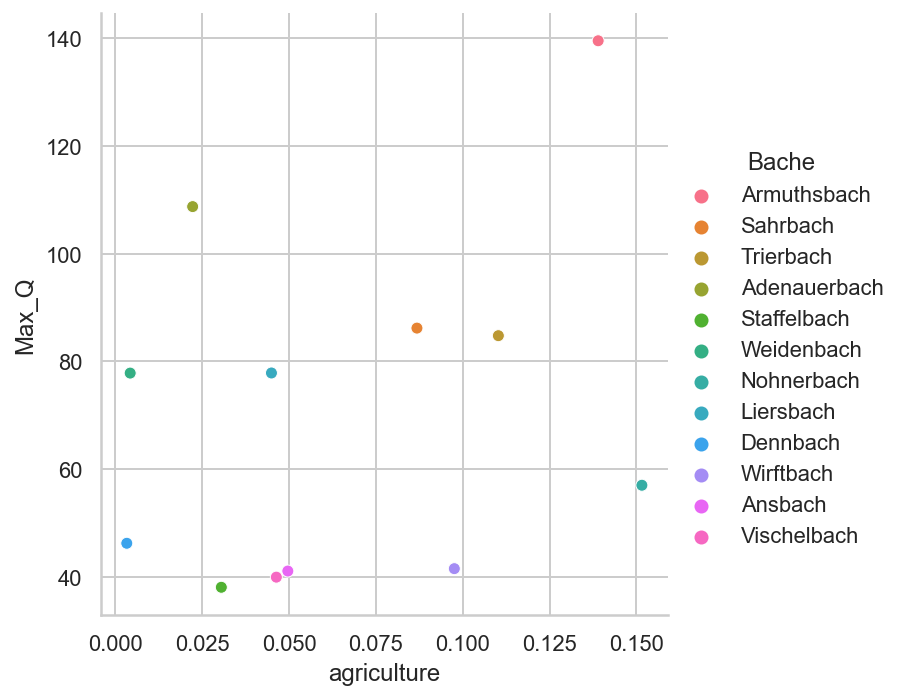
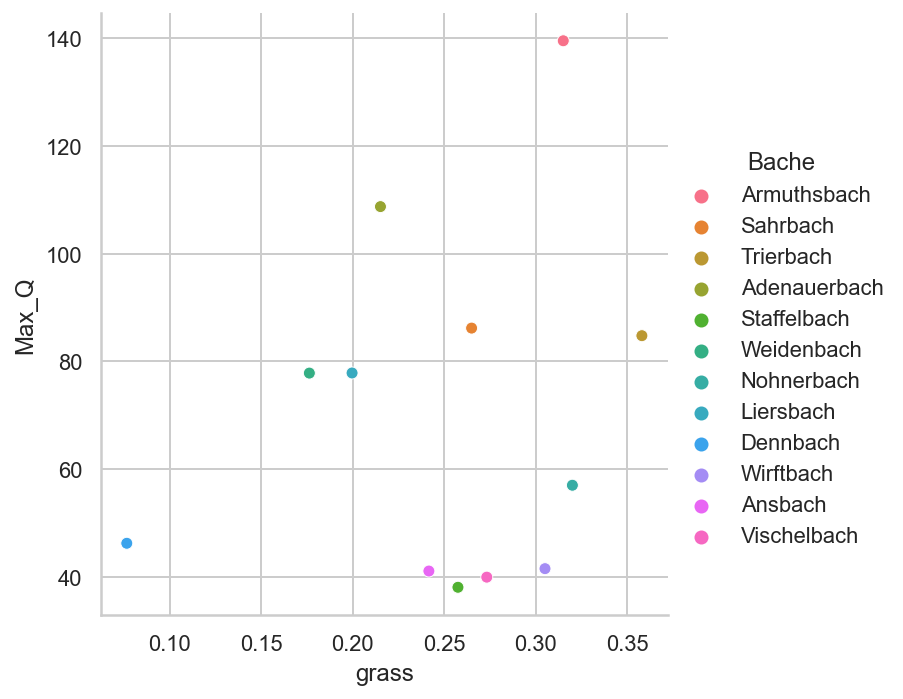
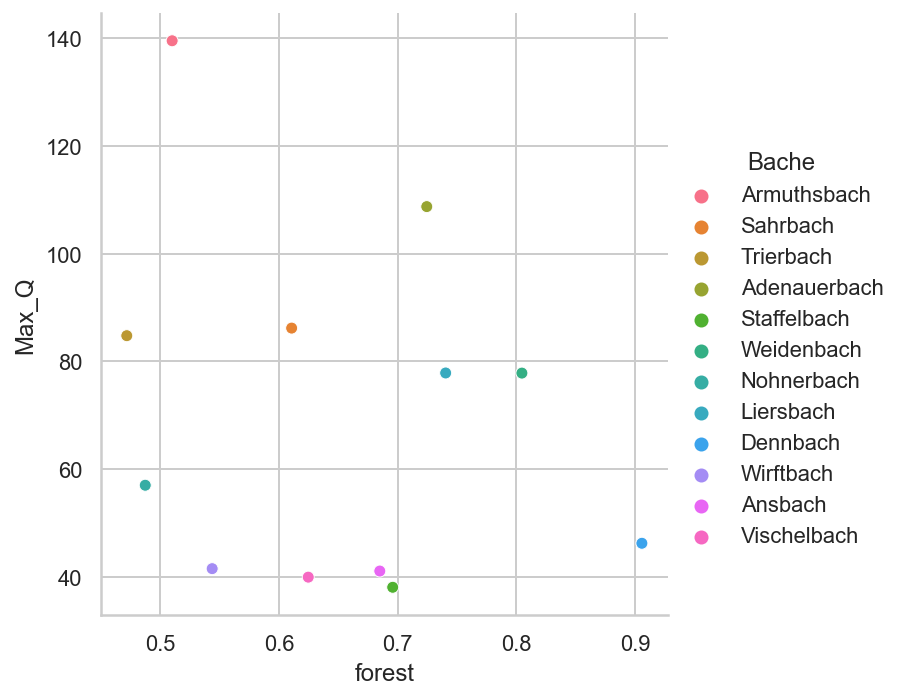
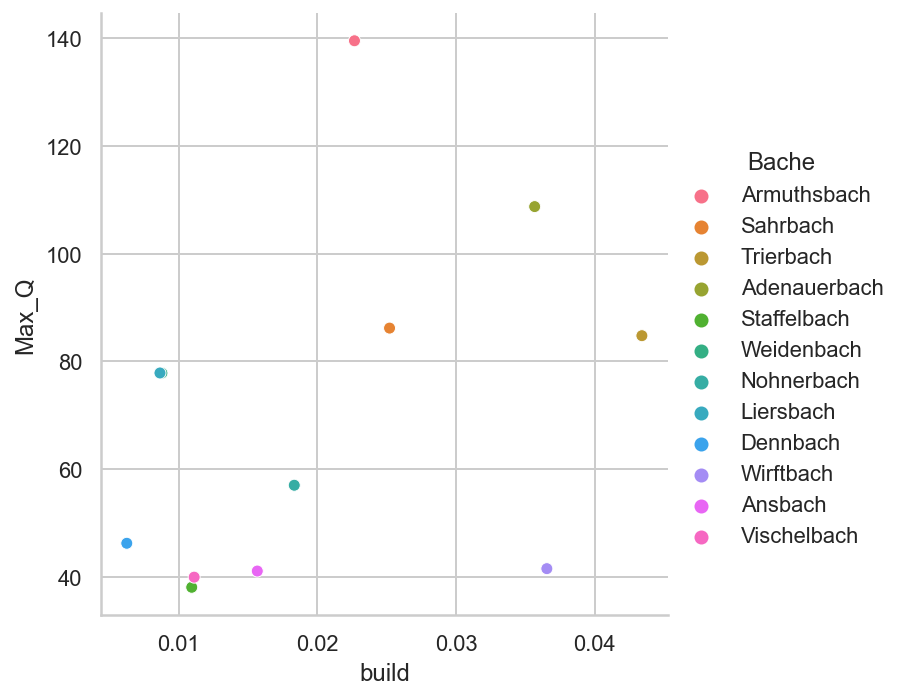
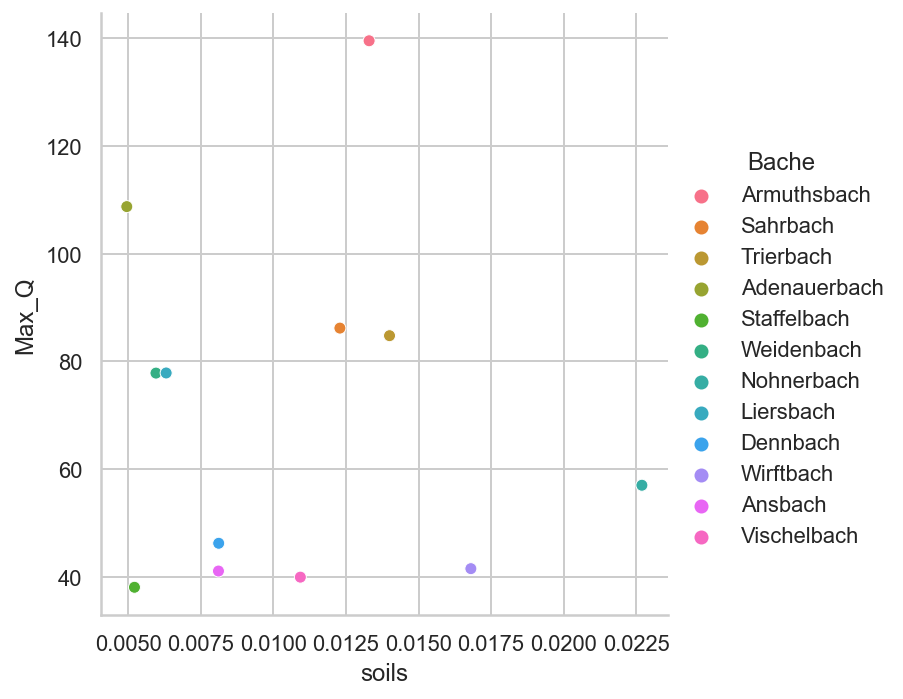
1.1.0.1 Precipitation aggregated statistics
Most rainfall data is collected by "official" or public pluviometers. However, for the Ahrbrück data this was a privately owned device. They both share the constraint that the online availability of the hourly data is constrained in time, so after 1 or a few months only daily data can be consulted.
| Dreis-Brück | Nürburg-Barweiler | Kaltenborn | Adenau | Mayschoß | Freilingen_NRW | |
|---|---|---|---|---|---|---|
| datetime | ||||||
| 2021-07-14 00:00:00 | 0.0 | 0.0 | 0.0 | 0.0 | 0.0 | 0.00 |
| 2021-07-14 01:00:00 | 0.0 | 0.0 | 0.0 | 0.0 | 0.0 | 0.00 |
| 2021-07-14 02:00:00 | 0.0 | 0.0 | 0.0 | 0.0 | 0.0 | 0.00 |
| 2021-07-14 03:00:00 | 0.0 | 0.0 | 0.0 | 0.0 | 0.0 | 0.00 |
| 2021-07-14 04:00:00 | 0.0 | 0.0 | 0.0 | 0.0 | 0.0 | 0.00 |
| 2021-07-14 05:00:00 | 0.0 | 0.0 | 0.0 | 0.0 | 0.1 | 0.00 |
| 2021-07-14 06:00:00 | 0.0 | 0.0 | 0.0 | 0.0 | 1.2 | 0.14 |
| 2021-07-14 07:00:00 | 0.1 | 0.4 | 0.3 | 0.5 | 1.9 | 3.81 |
| 2021-07-14 08:00:00 | 1.0 | 2.3 | 1.6 | 0.1 | 1.0 | 4.92 |
| 2021-07-14 09:00:00 | 4.3 | 5.0 | 3.1 | 2.7 | 1.2 | 3.17 |
| 2021-07-14 10:00:00 | 2.9 | 2.4 | 5.8 | 2.0 | 6.1 | 4.58 |
| 2021-07-14 11:00:00 | 11.4 | 12.2 | 4.1 | 7.6 | 10.2 | 3.92 |
| 2021-07-14 12:00:00 | 19.3 | 18.9 | 14.6 | 19.6 | 4.9 | 3.37 |
| 2021-07-14 13:00:00 | 10.8 | 14.4 | 9.8 | 8.5 | 10.8 | 2.56 |
| 2021-07-14 14:00:00 | 8.8 | 10.3 | 8.6 | 10.3 | 9.5 | 8.01 |
| 2021-07-14 15:00:00 | 6.2 | 6.6 | 6.2 | 5.2 | 6.6 | 14.74 |
| 2021-07-14 16:00:00 | 6.5 | 7.5 | 7.5 | 9.3 | 9.1 | 12.78 |
| 2021-07-14 17:00:00 | 17.0 | NaN | 5.8 | 5.3 | 9.2 | 19.43 |
| 2021-07-14 18:00:00 | 6.0 | NaN | 4.3 | 3.9 | 5.2 | 18.69 |
| 2021-07-14 19:00:00 | 4.8 | NaN | 4.2 | 4.4 | 6.5 | 8.32 |
| 2021-07-14 20:00:00 | 3.5 | NaN | 3.6 | 3.1 | 2.6 | 6.06 |
| 2021-07-14 21:00:00 | 0.1 | NaN | 0.0 | 0.0 | 0.0 | 0.74 |
| 2021-07-14 22:00:00 | 0.0 | NaN | 0.0 | 0.0 | 0.0 | 0.10 |
| 2021-07-14 23:00:00 | 0.0 | NaN | 0.0 | 0.0 | 0.0 | 0.11 |
This was good data, but we need also hourly data for the days leading up to 14 July.
<AxesSubplot:xlabel='datetime'>

Dreis-Brück          102.70
Nürburg-Barweiler     80.00
Kaltenborn            79.50
Adenau                82.50
Mayschoß              86.10
Freilingen_NRW       115.45
dtype: float64
Reading sheet RFmeans
| Barweiler | Dreis-Brück | Kaltenborn | Freilingen | Esch | Scheuerheck&Wald | Ahrbrück | Neuenahr | |
|---|---|---|---|---|---|---|---|---|
| PRECIP | ||||||||
| Mean1407 | 4.71 | 4.27 | 3.30 | 4.81 | 3.71 | 6.40 | 5.46 | 2.80 |
| Max1407 | 18.90 | 19.34 | 14.55 | 19.43 | 15.03 | 35.00 | NaN | 9.20 |
| SUM1407 | 80.00 | 102.60 | 79.23 | 115.45 | 89.10 | 140.85 | 131.08 | 67.20 |
| Mean1307 | 0.86 | 0.94 | 0.87 | 0.62 | 1.25 | NaN | 0.69 | 0.71 |
| Max1307 | 6.00 | 7.07 | 10.91 | 3.95 | 26.20 | NaN | NaN | 14.50 |
| SUM1307 | 20.60 | 22.49 | 20.76 | 14.77 | 30.00 | NaN | 16.60 | 17.80 |
| PRECIP | Mean1407 | Max1407 | SUM1407 | Mean1307 | Max1307 | SUM1307 |
|---|---|---|---|---|---|---|
| Barweiler | 4.71 | 18.90 | 80.00 | 0.86 | 6.00 | 20.60 |
| Dreis-Brück | 4.27 | 19.34 | 102.60 | 0.94 | 7.07 | 22.49 |
| Kaltenborn | 3.30 | 14.55 | 79.23 | 0.87 | 10.91 | 20.76 |
| Freilingen | 4.81 | 19.43 | 115.45 | 0.62 | 3.95 | 14.77 |
| Esch | 3.71 | 15.03 | 89.10 | 1.25 | 26.20 | 30.00 |
| Scheuerheck&Wald | 6.40 | 35.00 | 140.85 | NaN | NaN | NaN |
| Ahrbrück | 5.46 | NaN | 131.08 | 0.69 | NaN | 16.60 |
| Neuenahr | 2.80 | 9.20 | 67.20 | 0.71 | 14.50 | 17.80 |
We can now link the pluvio and stream properties together:
Index(['Armuthsbach', 'Sahrbach', 'Trierbach', 'Adenauerbach', 'Staffelbach',
       'Nohnerbach', 'Liersbach', 'Dennbach', 'Wirftbach', 'Ansbach'],
      dtype='object', name='Bache')
1.1.0.2 The total rainfall on 14-07-2021
This is the situation before I found the Ahrbrück pluvio data.
updated pluvio data after applying thiessen polygons on the catchments again:
| agriculture | grass | forest | build | soils | Max_Q | Oppv | SUM1407 | |
|---|---|---|---|---|---|---|---|---|
| Bache | ||||||||
| Armuthsbach | 1.39e-01 | 0.32 | 0.51 | 2.27e-02 | 1.33e-02 | 139.48 | 72.56 | 115.45 |
| Sahrbach | 8.68e-02 | 0.26 | 0.61 | 2.52e-02 | 1.23e-02 | 86.19 | 45.60 | 115.45 |
| Trierbach | 1.10e-01 | 0.36 | 0.47 | 4.34e-02 | 1.40e-02 | 84.78 | 55.15 | 80.00 |
| Adenauerbach | 2.23e-02 | 0.22 | 0.72 | 3.57e-02 | 4.95e-03 | 108.72 | 67.18 | 80.00 |
| Staffelbach | 3.05e-02 | 0.26 | 0.70 | 1.09e-02 | 5.21e-03 | 38.12 | 37.04 | 89.10 |
| Nohnerbach | 1.52e-01 | 0.32 | 0.49 | 1.83e-02 | 2.27e-02 | 57.05 | 31.14 | 102.60 |
| Liersbach | 4.49e-02 | 0.20 | 0.74 | 8.65e-03 | 6.30e-03 | 77.87 | 18.43 | 115.45 |
| Dennbach | 3.30e-03 | 0.08 | 0.91 | 6.26e-03 | 8.11e-03 | 46.28 | 19.39 | 79.23 |
| Wirftbach | 9.76e-02 | 0.31 | 0.54 | 3.65e-02 | 1.68e-02 | 41.57 | 25.11 | 80.00 |
| Ansbach | 4.97e-02 | 0.24 | 0.68 | 1.57e-02 | 8.11e-03 | 41.13 | 16.70 | 115.45 |
1.1.1 Heatmap: individual discharges of main Ahr tributaries
and also the calculated discharge at Altenahr.
| Flow rate (m³/s) | Latitude | Longitude | |
|---|---|---|---|
| Time | |||
| 2021-07-13 00:00:00 | 0.00e+00 | 50.38 | 6.81 |
| 2021-07-13 00:15:00 | 0.00e+00 | 50.38 | 6.81 |
| 2021-07-13 00:30:00 | 0.00e+00 | 50.38 | 6.81 |
| 2021-07-13 00:45:00 | 5.00e-05 | 50.38 | 6.81 |
| 2021-07-13 01:00:00 | 5.00e-05 | 50.38 | 6.81 |
Resampling 15m. -> 1 hour.
| Flow rate (m³/s) | Latitude | Longitude | |
|---|---|---|---|
| Time | |||
| 2021-06-10 00:00:00 | 0.0 | 50.52 | 6.99 |
| 2021-06-10 01:00:00 | 0.0 | 50.52 | 6.99 |
| 2021-06-10 02:00:00 | 0.0 | 50.52 | 6.99 |
| 2021-06-10 03:00:00 | 0.0 | 50.52 | 6.99 |
| 2021-06-10 04:00:00 | 0.0 | 50.52 | 6.99 |
| Flow rate (m³/s) | Latitude | Longitude | |
|---|---|---|---|
| Time | |||
| 2021-06-10 00:00:00 | 0.0 | 50.44 | 6.93 |
| 2021-06-10 01:00:00 | 0.0 | 50.44 | 6.93 |
| 2021-06-10 02:00:00 | 0.0 | 50.44 | 6.93 |
| 2021-06-10 03:00:00 | 0.0 | 50.44 | 6.93 |
| 2021-06-10 04:00:00 | 0.0 | 50.44 | 6.93 |
| Flow rate (m³/s) | Latitude | Longitude | |
|---|---|---|---|
| Time | |||
| 2021-07-07 00:00:00 | 0.0 | 50.51 | 6.97 |
| 2021-07-07 00:15:00 | 0.0 | 50.51 | 6.97 |
| 2021-07-07 00:30:00 | 0.0 | 50.51 | 6.97 |
| 2021-07-07 00:45:00 | 0.0 | 50.51 | 6.97 |
| 2021-07-07 01:00:00 | 0.0 | 50.51 | 6.97 |
| Flow rate (m³/s) | Latitude | Longitude | |
|---|---|---|---|
| Time | |||
| 2021-07-13 00:00:00 | 0.00e+00 | 50.45 | 6.87 |
| 2021-07-13 01:00:00 | 0.00e+00 | 50.45 | 6.87 |
| 2021-07-13 02:00:00 | 0.00e+00 | 50.45 | 6.87 |
| 2021-07-13 03:00:00 | 0.00e+00 | 50.45 | 6.87 |
| 2021-07-13 04:00:00 | 3.31e-04 | 50.45 | 6.87 |
| Flow rate (m³/s) | Latitude | Longitude | |
|---|---|---|---|
| Time | |||
| 2021-07-13 00:00:00 | 0.00e+00 | 50.36 | 6.83 |
| 2021-07-13 01:00:00 | NaN | NaN | NaN |
| 2021-07-13 02:00:00 | 4.54e-03 | 50.36 | 6.83 |
| 2021-07-13 03:00:00 | 2.09e-02 | 50.36 | 6.83 |
| 2021-07-13 04:00:00 | 4.65e-02 | 50.36 | 6.83 |
| Flow rate (m³/s) | Latitude | Longitude | |
|---|---|---|---|
| Time | |||
| 2021-07-17 04:00:00 | 0.0 | 50.38 | 6.81 |
| 2021-07-17 05:00:00 | 0.0 | 50.38 | 6.81 |
| 2021-07-17 06:00:00 | 0.0 | 50.38 | 6.81 |
| 2021-07-17 07:00:00 | 0.0 | 50.38 | 6.81 |
| 2021-07-17 08:00:00 | 0.0 | 50.38 | 6.81 |
We pick highwater times, and normalize the flow rates
| Flow rate (m³/s) | Latitude | Longitude | |
|---|---|---|---|
| Time | |||
| 2021-07-14 10:00:00 | 1.00 | 50.38 | 6.81 |
| 2021-07-14 11:00:00 | 2.51 | 50.38 | 6.81 |
| 2021-07-14 12:00:00 | 7.27 | 50.38 | 6.81 |
| 2021-07-14 13:00:00 | 20.43 | 50.38 | 6.81 |
| 2021-07-14 14:00:00 | 49.30 | 50.38 | 6.81 |
| 2021-07-14 15:00:00 | 96.68 | 50.38 | 6.81 |
| 2021-07-14 16:00:00 | 154.55 | 50.38 | 6.81 |
| 2021-07-14 17:00:00 | 211.21 | 50.38 | 6.81 |
| 2021-07-14 18:00:00 | 260.75 | 50.38 | 6.81 |
| 2021-07-14 19:00:00 | 303.90 | 50.38 | 6.81 |
| 2021-07-14 20:00:00 | 343.49 | 50.38 | 6.81 |
| 2021-07-14 21:00:00 | 372.30 | 50.38 | 6.81 |
| 2021-07-14 22:00:00 | 382.54 | 50.38 | 6.81 |
| 2021-07-14 23:00:00 | 381.22 | 50.38 | 6.81 |
| 2021-07-15 00:00:00 | 363.95 | 50.38 | 6.81 |
| 2021-07-15 01:00:00 | 325.51 | 50.38 | 6.81 |
| 2021-07-15 02:00:00 | 274.04 | 50.38 | 6.81 |
| 2021-07-15 03:00:00 | 217.98 | 50.38 | 6.81 |
| 2021-07-15 04:00:00 | 164.70 | 50.38 | 6.81 |
| 2021-07-15 05:00:00 | 119.03 | 50.38 | 6.81 |
| 2021-07-15 06:00:00 | 82.61 | 50.38 | 6.81 |
| 2021-07-15 07:00:00 | 55.39 | 50.38 | 6.81 |
| 2021-07-15 08:00:00 | 36.00 | 50.38 | 6.81 |
C:\Users\Kurt\AppData\Local\Temp/ipykernel_12016/4269201848.py:1: SettingWithCopyWarning:
A value is trying to be set on a copy of a slice from a DataFrame.
Try using .loc[row_indexer,col_indexer] = value instead

See the caveats in the documentation: https://pandas.pydata.org/pandas-docs/stable/user_guide/indexing.html#returning-a-view-versus-a-copy
  Upper_["Flow"]= Upper_["Flow rate (m³/s)"]/ Upper_["Flow rate (m³/s)"].max()
| Flow rate (m³/s) | Latitude | Longitude | Flow | |
|---|---|---|---|---|
| Time | ||||
| 2021-07-14 10:00:00 | 1.00 | 50.38 | 6.81 | 2.62e-03 |
| 2021-07-14 11:00:00 | 2.51 | 50.38 | 6.81 | 6.57e-03 |
| 2021-07-14 12:00:00 | 7.27 | 50.38 | 6.81 | 1.90e-02 |
| 2021-07-14 13:00:00 | 20.43 | 50.38 | 6.81 | 5.34e-02 |
| 2021-07-14 14:00:00 | 49.30 | 50.38 | 6.81 | 1.29e-01 |
| 2021-07-14 15:00:00 | 96.68 | 50.38 | 6.81 | 2.53e-01 |
| 2021-07-14 16:00:00 | 154.55 | 50.38 | 6.81 | 4.04e-01 |
| 2021-07-14 17:00:00 | 211.21 | 50.38 | 6.81 | 5.52e-01 |
| 2021-07-14 18:00:00 | 260.75 | 50.38 | 6.81 | 6.82e-01 |
| 2021-07-14 19:00:00 | 303.90 | 50.38 | 6.81 | 7.94e-01 |
| 2021-07-14 20:00:00 | 343.49 | 50.38 | 6.81 | 8.98e-01 |
| 2021-07-14 21:00:00 | 372.30 | 50.38 | 6.81 | 9.73e-01 |
| 2021-07-14 22:00:00 | 382.54 | 50.38 | 6.81 | 1.00e+00 |
| 2021-07-14 23:00:00 | 381.22 | 50.38 | 6.81 | 9.97e-01 |
| 2021-07-15 00:00:00 | 363.95 | 50.38 | 6.81 | 9.51e-01 |
| 2021-07-15 01:00:00 | 325.51 | 50.38 | 6.81 | 8.51e-01 |
| 2021-07-15 02:00:00 | 274.04 | 50.38 | 6.81 | 7.16e-01 |
| 2021-07-15 03:00:00 | 217.98 | 50.38 | 6.81 | 5.70e-01 |
| 2021-07-15 04:00:00 | 164.70 | 50.38 | 6.81 | 4.31e-01 |
| 2021-07-15 05:00:00 | 119.03 | 50.38 | 6.81 | 3.11e-01 |
| 2021-07-15 06:00:00 | 82.61 | 50.38 | 6.81 | 2.16e-01 |
| 2021-07-15 07:00:00 | 55.39 | 50.38 | 6.81 | 1.45e-01 |
| 2021-07-15 08:00:00 | 36.00 | 50.38 | 6.81 | 9.41e-02 |
| Flow rate (m³/s) | Latitude | Longitude | Flow | |
|---|---|---|---|---|
| Time | ||||
| 2021-07-15 06:00:00 | 0.33 | 50.44 | 6.93 | 2.84e-03 |
| 2021-07-15 07:00:00 | 0.12 | 50.44 | 6.93 | 1.00e-03 |
| 2021-07-15 08:00:00 | 0.04 | 50.44 | 6.93 | 3.40e-04 |
| agriculture | grass | forest | build | soils | Log_Q_area | |
|---|---|---|---|---|---|---|
| Bache | ||||||
| Wirftbach | 0.10 | 0.31 | 0.54 | 0.04 | 1.68e-02 | 0.50 |
| Ansbach | 0.05 | 0.24 | 0.68 | 0.02 | 8.11e-03 | 0.90 |
| Vischelbach | 0.05 | 0.27 | 0.62 | 0.01 | 1.09e-02 | 0.66 |
| Time | Flow rate (m³/s) | Latitude | Longitude | Flow | |
|---|---|---|---|---|---|
| 18 | 2021-07-15 04:00:00 | 0.99 | 50.36 | 6.83 | 1.17e-02 |
| 19 | 2021-07-15 05:00:00 | 0.46 | 50.36 | 6.83 | 5.45e-03 |
| 20 | 2021-07-15 06:00:00 | 0.21 | 50.36 | 6.83 | 2.46e-03 |
| 21 | 2021-07-15 07:00:00 | 0.09 | 50.36 | 6.83 | 1.09e-03 |
| 22 | 2021-07-15 08:00:00 | 0.04 | 50.36 | 6.83 | 4.69e-04 |
'0.12.1'
1.1.2 Corine land cover 2018 data
| Value | Number | Percent | clc_legend_GRID_CODE | clc_legend_LABEL1 | clc_legend_LABEL2 | clc_legend_LABEL3 | |
|---|---|---|---|---|---|---|---|
| 0 | 112 | 916 | 0.036325 | 2 | Artificial surfaces | Urban fabric | Discontinuous urban fabric |
| 1 | 121 | 71 | 0.002816 | 3 | Artificial surfaces | Industrial, commercial and transport units | Industrial or commercial units |
| 2 | 122 | 28 | 0.001110 | 4 | Artificial surfaces | Industrial, commercial and transport units | Road and rail networks and associated land |
| 3 | 131 | 120 | 0.004759 | 7 | Artificial surfaces | Mine, dump and construction sites | Mineral extraction sites |
| 4 | 133 | 2 | 0.000079 | 9 | Artificial surfaces | Mine, dump and construction sites | Construction sites |
| 5 | 211 | 2129 | 0.084427 | 12 | Agricultural areas | Arable land | Non-irrigated arable land |
| 6 | 231 | 11833 | 0.469247 | 18 | Agricultural areas | Pastures | Pastures |
| 7 | 242 | 61 | 0.002419 | 20 | Agricultural areas | Heterogeneous agricultural areas | Complex cultivation patterns |
| 8 | 243 | 39 | 0.001547 | 21 | Agricultural areas | Heterogeneous agricultural areas | Land principally occupied by agriculture, with... |
| 9 | 311 | 4155 | 0.164770 | 23 | Forest and semi natural areas | Forests | Broad-leaved forest |
| 10 | 312 | 4196 | 0.166396 | 24 | Forest and semi natural areas | Forests | Coniferous forest |
| 11 | 313 | 1497 | 0.059365 | 25 | Forest and semi natural areas | Forests | Mixed forest |
| 12 | 321 | 29 | 0.001150 | 26 | Forest and semi natural areas | Scrub and/or herbaceous vegetation associations | Natural grasslands |
| 13 | 324 | 141 | 0.005591 | 29 | Forest and semi natural areas | Scrub and/or herbaceous vegetation associations | Transitional woodland-shrub |
1.2 Long historical rainfall series: Trier
| Row | Latitude | Longitude | Niederschlag | |
|---|---|---|---|---|
| Date | ||||
| 1972-01-01 | 1 | 49.75 | 6.66 | 0.0 |
| 1972-01-02 | 2 | 49.75 | 6.66 | 0.0 |
| 1972-01-03 | 3 | 49.75 | 6.66 | 4.6 |
| 1972-01-04 | 4 | 49.75 | 6.66 | 1.7 |
| 1972-01-05 | 5 | 49.75 | 6.66 | 0.3 |
There is a cutoff point at midnight, so I'll take a roling sum of 3 days.
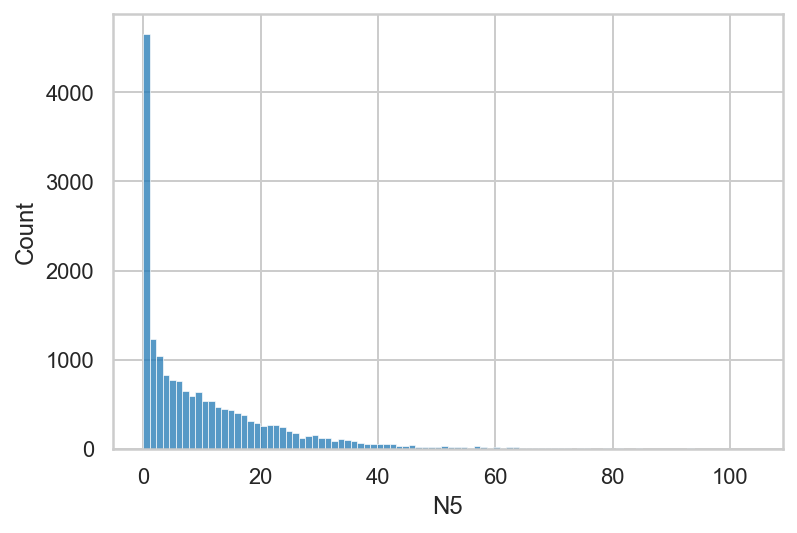
Date
1972-12-31    44.0
1973-12-31    32.7
1974-12-31    43.1
1975-12-31    53.4
1976-12-31    31.2
1977-12-31    37.0
1978-12-31    24.4
1979-12-31    31.6
1980-12-31    56.7
1981-12-31    41.6
1982-12-31    32.6
1983-12-31    31.1
1984-12-31    39.3
1985-12-31    37.6
1986-12-31    28.3
1987-12-31    25.4
1988-12-31    28.1
1989-12-31    43.5
1990-12-31    34.2
1991-12-31    20.5
1992-12-31    27.0
1993-12-31    45.5
1994-12-31    46.0
1995-12-31    51.3
1996-12-31    37.9
1997-12-31    29.0
1998-12-31    37.0
1999-12-31    25.7
2000-12-31    48.8
2001-12-31    34.0
2002-12-31    27.5
2003-12-31    33.1
2004-12-31    34.2
2005-12-31    44.5
2006-12-31    36.2
2007-12-31    23.6
2008-12-31    33.1
2009-12-31    41.2
2010-12-31    21.1
2011-12-31    33.3
2012-12-31    28.5
2013-12-31    38.6
2014-12-31    32.0
2015-12-31    26.5
2016-12-31    31.9
2017-12-31    29.3
2018-12-31    43.4
2019-12-31    55.4
2020-12-31    28.8
2021-12-31    63.9
Freq: A-DEC, Name: Niederschlag, dtype: float64
Date
2021-07-14    63.9
1980-08-16    56.7
2019-07-11    55.4
1975-08-21    53.4
1995-01-22    51.3
2000-05-11    48.8
2000-07-07    47.3
1994-07-18    46.0
1993-07-30    45.5
2005-07-29    44.5
1972-11-17    44.0
1989-08-07    43.5
2018-09-05    43.4
1974-07-13    43.1
1972-07-24    42.9
2018-05-31    42.6
1981-04-26    41.6
2009-06-15    41.2
1984-05-05    39.3
2013-05-19    38.6
Name: Niederschlag, dtype: float64
<AxesSubplot:xlabel='Niederschlag', ylabel='Count'>
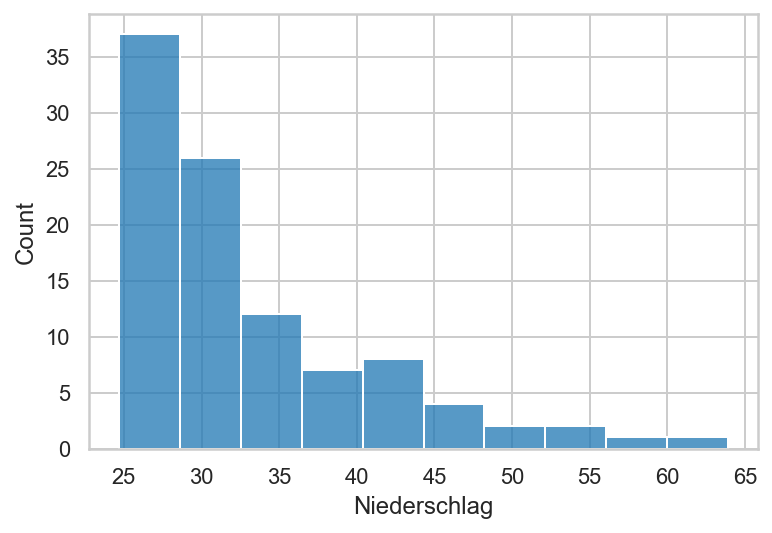
Date
2021-07-14    93.1
2021-07-15    80.0
1980-08-16    74.9
1980-08-17    74.9
1995-01-22    73.3
1995-01-23    71.8
2018-06-01    70.2
2003-01-03    69.5
1981-04-28    69.3
2004-05-08    68.7
2003-01-02    67.5
2000-07-09    66.4
1981-04-27    66.3
1984-09-08    64.9
2021-07-16    63.9
1975-08-22    62.4
1975-08-23    62.3
1978-12-30    61.7
2016-05-30    61.7
1978-12-31    61.2
Name: N3, dtype: float64
Date
1995-01-25    103.8
2021-07-14     93.9
2021-07-15     93.1
2021-07-16     93.1
2016-06-02     92.8
1995-01-26     92.5
2003-01-04     90.1
2003-01-05     87.0
2016-06-01     84.9
1984-09-08     84.7
1995-01-22     84.6
2003-01-02     84.2
1995-01-24     81.8
1998-10-31     81.0
1998-10-28     80.7
2021-07-17     80.0
1978-12-31     79.2
1993-12-23     78.5
1980-08-16     78.1
2000-07-08     77.2
Name: N5, dtype: float64
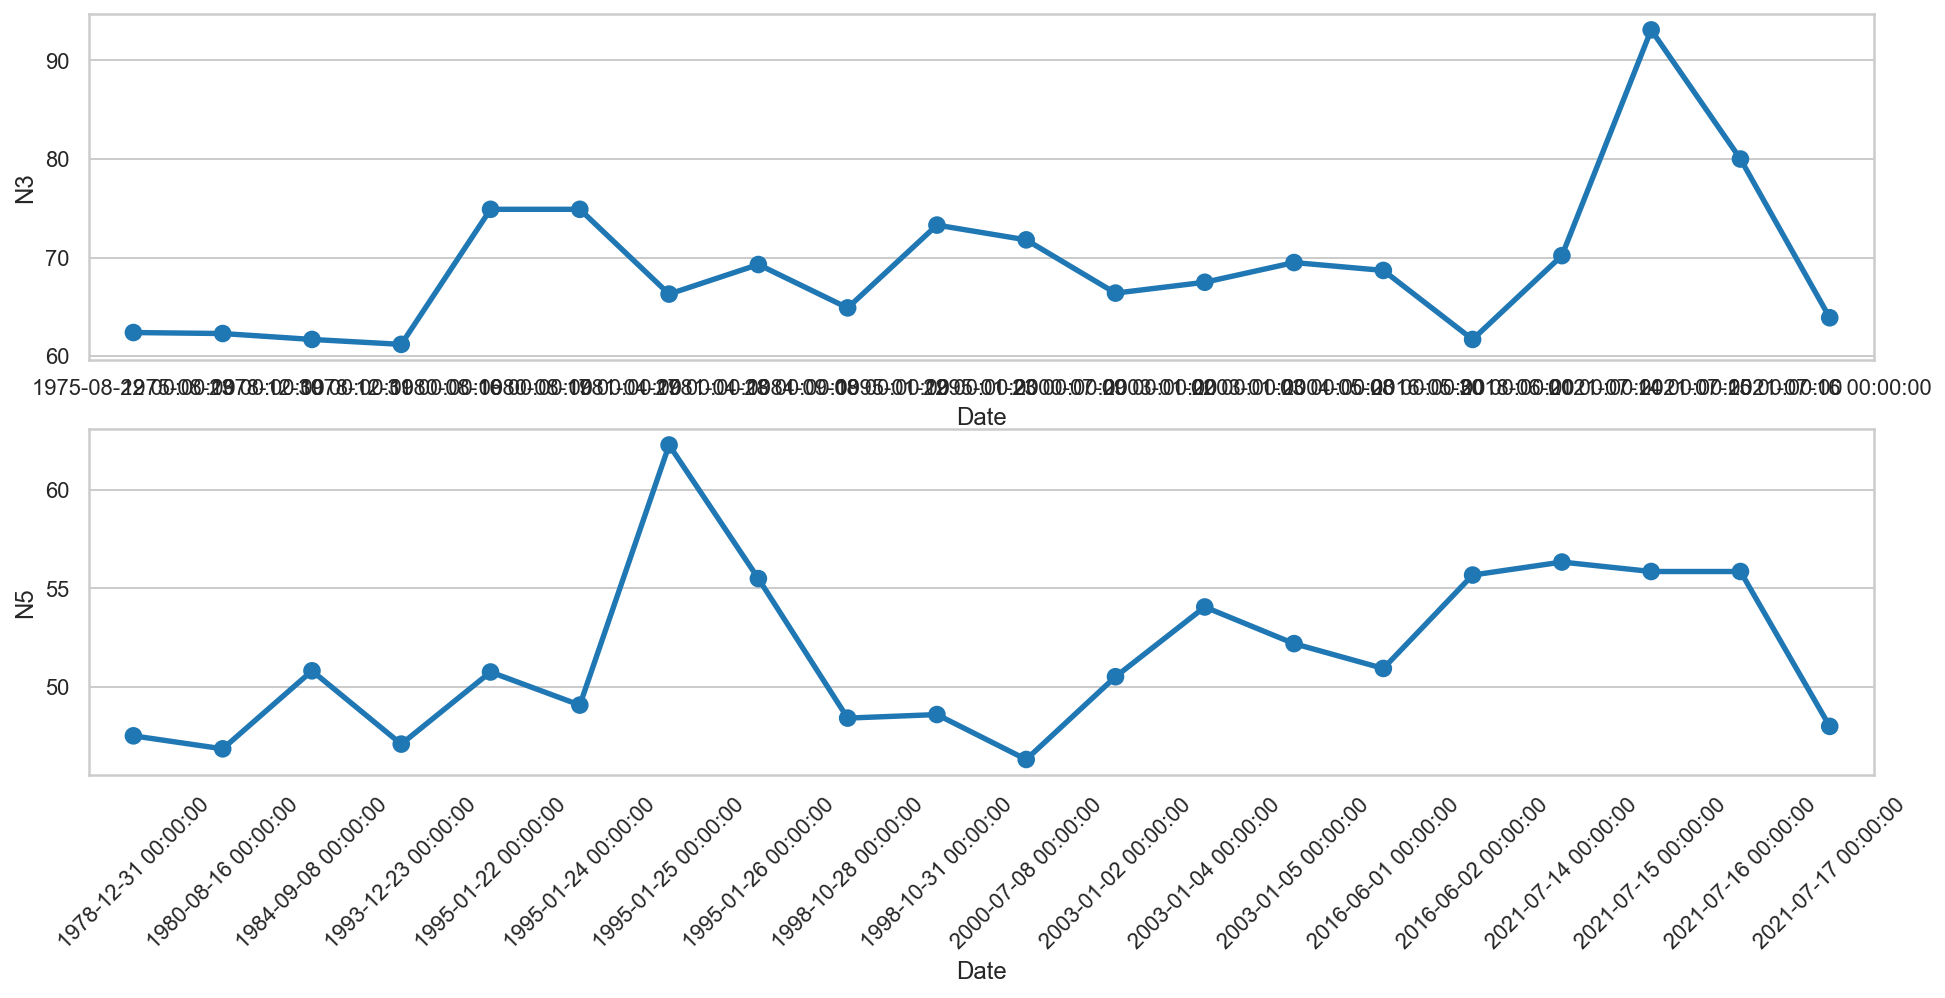
<class 'pandas.core.frame.DataFrame'>
DatetimeIndex: 20 entries, 1975-08-22 to 2021-07-16
Data columns (total 1 columns):
 #   Column  Non-Null Count  Dtype
---  ------  --------------  -----
 0   N3      20 non-null     float64
dtypes: float64(1)
memory usage: 876.0 bytes
Date
1972-12-31    44.0
1973-12-31    32.7
1974-12-31    43.1
1975-12-31    53.4
1976-12-31    31.2
1977-12-31    37.0
1978-12-31    24.4
1979-12-31    31.6
1980-12-31    56.7
1981-12-31    41.6
1982-12-31    32.6
1983-12-31    31.1
1984-12-31    39.3
1985-12-31    37.6
1986-12-31    28.3
1987-12-31    25.4
1988-12-31    28.1
1989-12-31    43.5
1990-12-31    34.2
1991-12-31    20.5
1992-12-31    27.0
1993-12-31    45.5
1994-12-31    46.0
1995-12-31    51.3
1996-12-31    37.9
1997-12-31    29.0
1998-12-31    37.0
1999-12-31    25.7
2000-12-31    48.8
2001-12-31    34.0
2002-12-31    27.5
2003-12-31    33.1
2004-12-31    34.2
2005-12-31    44.5
2006-12-31    36.2
2007-12-31    23.6
2008-12-31    33.1
2009-12-31    41.2
2010-12-31    21.1
2011-12-31    33.3
2012-12-31    28.5
2013-12-31    38.6
2014-12-31    32.0
2015-12-31    26.5
2016-12-31    31.9
2017-12-31    29.3
2018-12-31    43.4
2019-12-31    55.4
2020-12-31    28.8
2021-12-31    63.9
Freq: A-DEC, Name: Niederschlag, dtype: float64
| RANK | PEAK_FLOW_VALUE_Q(cfs) | LOGQ_cfs | (log Q – avg(logQ))^2 | (log Q – avg(logQ))^3 | Return Period (n+1)/m | Exceedence Probability (1/Tr) | |
|---|---|---|---|---|---|---|---|
| YEAR OF PEAK FLOW | |||||||
| 2021 | 1 | 63.9 | 1.81 | 6.89e-02 | 1.81e-02 | 51.00 | 0.02 |
| 1980 | 2 | 56.7 | 1.75 | 4.43e-02 | 9.34e-03 | 25.50 | 0.04 |
| 2019 | 3 | 55.4 | 1.74 | 4.02e-02 | 8.06e-03 | 17.00 | 0.06 |
| 1975 | 4 | 53.4 | 1.73 | 3.41e-02 | 6.29e-03 | 12.75 | 0.08 |
| 1995 | 5 | 51.3 | 1.71 | 2.79e-02 | 4.67e-03 | 10.20 | 0.10 |
| 2000 | 6 | 48.8 | 1.69 | 2.11e-02 | 3.08e-03 | 8.50 | 0.12 |
| 1994 | 7 | 46.0 | 1.66 | 1.43e-02 | 1.72e-03 | 7.29 | 0.14 |
| 1993 | 8 | 45.5 | 1.66 | 1.32e-02 | 1.52e-03 | 6.38 | 0.16 |
| 2005 | 9 | 44.5 | 1.65 | 1.11e-02 | 1.17e-03 | 5.67 | 0.18 |
| 1972 | 10 | 44.0 | 1.64 | 1.01e-02 | 1.01e-03 | 5.10 | 0.20 |
| 1989 | 11 | 43.5 | 1.64 | 9.12e-03 | 8.71e-04 | 4.64 | 0.22 |
| 2018 | 12 | 43.4 | 1.64 | 8.93e-03 | 8.44e-04 | 4.25 | 0.24 |
| 1974 | 13 | 43.1 | 1.63 | 8.37e-03 | 7.66e-04 | 3.92 | 0.25 |
| 1981 | 14 | 41.6 | 1.62 | 5.79e-03 | 4.41e-04 | 3.64 | 0.27 |
| 2009 | 15 | 41.2 | 1.61 | 5.17e-03 | 3.72e-04 | 3.40 | 0.29 |
| 1984 | 16 | 39.3 | 1.59 | 2.64e-03 | 1.36e-04 | 3.19 | 0.31 |
| 2013 | 17 | 38.6 | 1.59 | 1.90e-03 | 8.29e-05 | 3.00 | 0.33 |
| 1996 | 18 | 37.9 | 1.58 | 1.27e-03 | 4.53e-05 | 2.83 | 0.35 |
| 1985 | 19 | 37.6 | 1.58 | 1.04e-03 | 3.34e-05 | 2.68 | 0.37 |
| 1977 | 20 | 37.0 | 1.57 | 6.36e-04 | 1.60e-05 | 2.55 | 0.39 |
The topic was not outflow, but rainfall in this case.
<AxesSubplot:xlabel='Return Period (n+1)/m', ylabel='PEAK_FLOW_VALUE_Q(cfs)'>
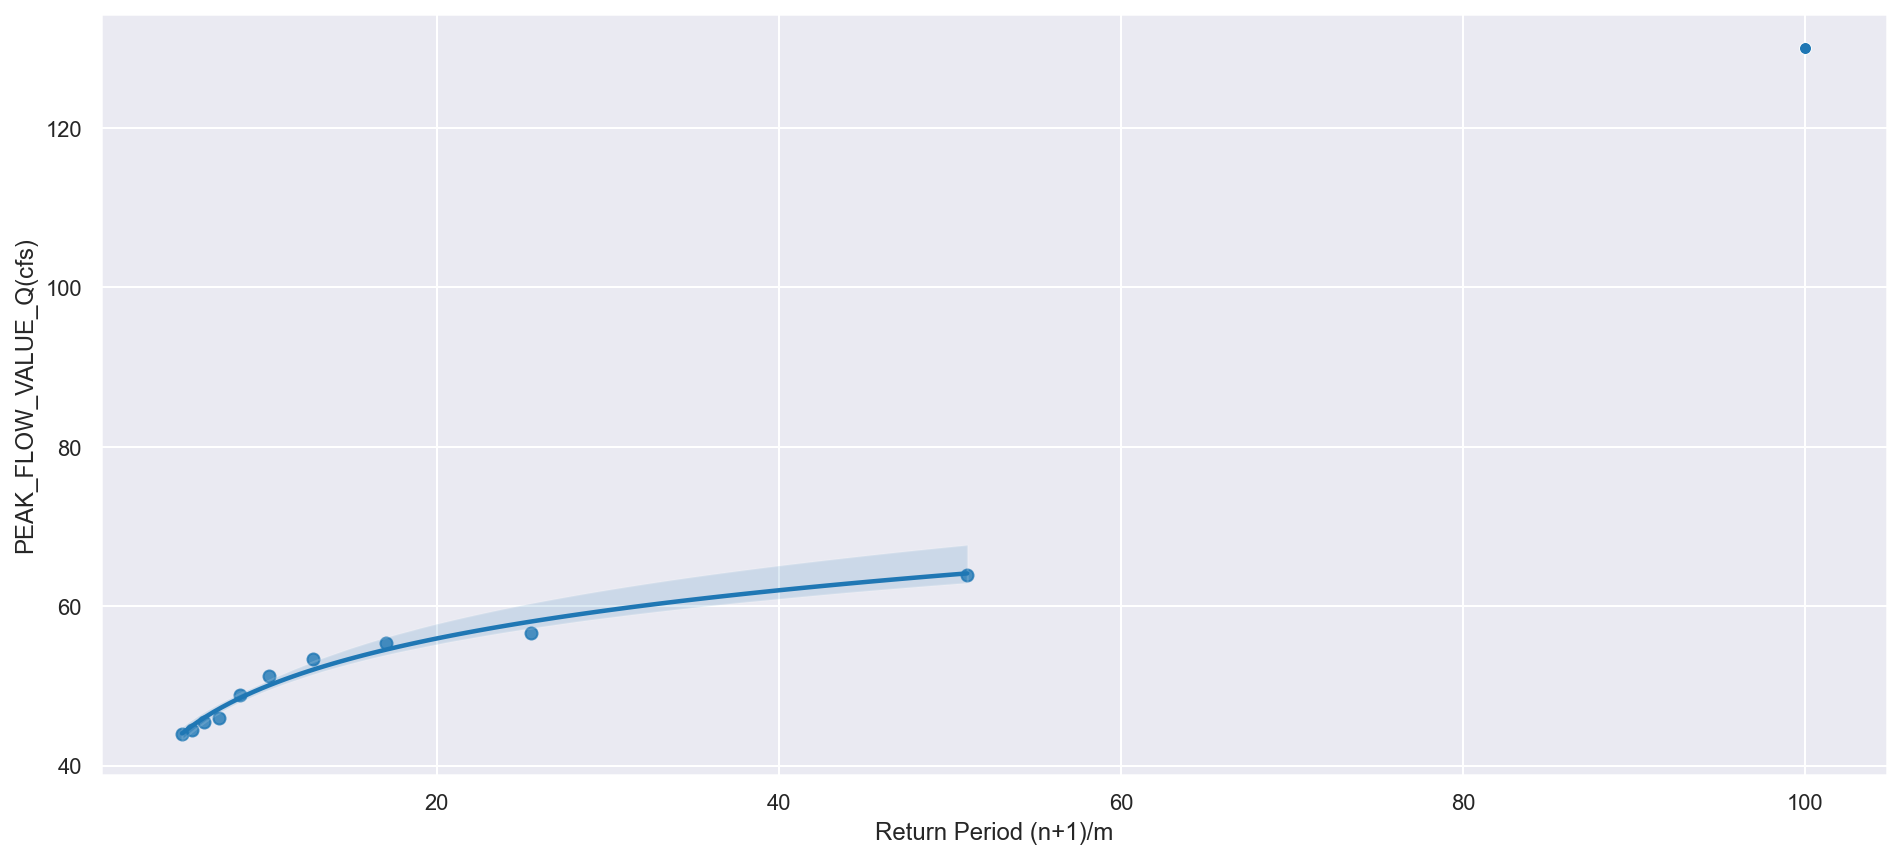
Reference: "Flood flow frequency", Bulletin 17B
1.2.1 Feature importances study
| Unnamed: 0 | agriculture | grassland | forest | build | bare_soils | slope | Bach_x | Distance | Lati | Long | Latitude | Longitude | Streamcode | Bach_y | Area | Max_Q | Bache | SUM1407 | Q_area | Log_Q_area | |
|---|---|---|---|---|---|---|---|---|---|---|---|---|---|---|---|---|---|---|---|---|---|
| 0 | 0 | 1.39e-01 | 0.32 | 0.51 | 2.27e-02 | 1.33e-02 | 1.08 | Armuthsbach | 18.80 | 50.45 | 6.87 | 50.47 | 6.71 | 271856 | Armuths | 72.60 | 139.48 | Armuthsbach | 140.85 | 1.92 | -4.37 |
| 1 | 1 | 8.68e-02 | 0.26 | 0.61 | 2.52e-02 | 1.23e-02 | 1.06 | Sahrbach | 2.17 | 50.51 | 6.97 | 50.54 | 6.85 | 27188 | Sahr | 45.60 | 86.19 | Sahrbach | 140.85 | 1.89 | -4.37 |
| 2 | 2 | 1.10e-01 | 0.36 | 0.47 | 4.34e-02 | 1.40e-02 | 0.84 | Trierbach | 34.00 | 50.36 | 6.83 | 50.30 | 6.91 | 27184 | Trier | 55.06 | 84.78 | Trierbach | 80.00 | 1.54 | -3.78 |
| 3 | 3 | 2.23e-02 | 0.22 | 0.72 | 3.57e-02 | 4.95e-03 | 1.70 | Adenauerbach | 11.20 | 50.44 | 6.93 | 50.35 | 6.97 | 27186 | Adenauer | 58.45 | 108.72 | Adenauerbach | 80.00 | 1.86 | -4.29 |
| 4 | 4 | 3.05e-02 | 0.26 | 0.70 | 1.09e-02 | 5.21e-03 | 1.67 | Staffelbach | 10.20 | 50.48 | 7.03 | 50.46 | 7.11 | 271874 | Staffel | 38.00 | 38.12 | Staffelbach | 79.00 | 1.00 | -4.88 |
| 5 | 5 | 4.28e-03 | 0.18 | 0.80 | 8.79e-03 | 5.95e-03 | 2.33 | Weidenbach | 8.30 | 50.48 | 7.02 | 50.39 | 7.03 | 2718741 | Weiden | 37.90 | 77.85 | Weidenbach | 79.23 | 2.05 | -4.50 |
| 6 | 6 | 1.52e-01 | 0.32 | 0.49 | 1.83e-02 | 2.27e-02 | 0.96 | Nohnerbach | 35.50 | 50.36 | 6.83 | 50.28 | 6.88 | 271812 | Nohner | 31.26 | 57.05 | Nohnerbach | 102.60 | 1.82 | -3.99 |
| 7 | 7 | 4.49e-02 | 0.20 | 0.74 | 8.65e-03 | 6.30e-03 | 2.30 | Liersbach | 10.00 | 50.46 | 6.94 | 50.53 | 6.83 | 271872 | Liers | 28.94 | 77.87 | Liersbach | 115.45 | 2.69 | -4.59 |
| 8 | 8 | 3.30e-03 | 0.08 | 0.91 | 6.26e-03 | 8.11e-03 | 1.68 | Dennbach | 6.30 | 50.48 | 6.99 | 50.42 | 6.97 | 2718748 | Denn | 20.00 | 46.28 | Dennbach | 99.99 | 2.31 | -4.28 |
| 9 | 9 | 9.76e-02 | 0.31 | 0.54 | 3.65e-02 | 1.68e-02 | 1.49 | Wirftbach | 22.00 | 50.37 | 6.84 | 50.34 | 6.93 | 271899 | Wirft | 25.20 | 41.57 | Wirftbach | 80.00 | 1.65 | -4.28 |
| 10 | 10 | 4.97e-02 | 0.24 | 0.68 | 1.57e-02 | 8.11e-03 | 1.37 | Ansbach | 22.00 | 50.43 | 6.85 | 50.44 | 6.75 | 271854 | Ans | 15.00 | 41.13 | Ansbach | 115.45 | 2.74 | -4.05 |
| 11 | 11 | 4.64e-02 | 0.27 | 0.62 | 1.11e-02 | 1.09e-02 | 1.45 | Vischelbach | 1.00 | 50.51 | 6.98 | 50.57 | 6.94 | 271892 | Vischel | 20.70 | 40.00 | Vischelbach | 131.00 | 1.93 | -4.59 |
Index(['wkt_geom', 'Treecover', 'Grassland', 'Cropland', 'Built-up',
       'Bare_spars', 'Waterbody', 'LULC_TOTAL', 'Unnamed: 0', 'agriculture',
       'grassland', 'forest', 'build', 'bare_soils', 'slope', 'sqrt_s',
       'Distance', 'Lati', 'Long', 'Latitude', 'Longitude', 'Streamcode',
       'Bach_y', 'Area', 'Max_Q', 'Bache', 'SUM1407', 'Q_area', 'Log_Q_area'],
      dtype='object')
| agriculture | grassland | forest | build | bare_soils | Treecover | Grassland | Cropland | Built-up | Bare_spars | Waterbody | slope | sqrt_s | Area | Max_Q | Q_area | |
|---|---|---|---|---|---|---|---|---|---|---|---|---|---|---|---|---|
| Bache | ||||||||||||||||
| Adenauerbach | 2.23e-02 | 0.22 | 0.72 | 3.57e-02 | 4.95e-03 | 0.84 | 0.14 | 4.89e-03 | 1.76e-02 | 1.54e-03 | 1.00e-06 | 1.79 | 1.34 | 58.45 | 108.72 | 1.86 |
| Ansbach | 4.97e-02 | 0.24 | 0.68 | 1.57e-02 | 8.11e-03 | 0.74 | 0.24 | 1.36e-02 | 6.92e-03 | 8.61e-04 | 0.00e+00 | 2.50 | 1.58 | 15.00 | 41.13 | 2.74 |
| Armuthsbach | 1.39e-01 | 0.32 | 0.51 | 2.27e-02 | 1.33e-02 | 0.57 | 0.38 | 3.90e-02 | 9.93e-03 | 1.28e-03 | 0.00e+00 | 1.71 | 1.31 | 72.60 | 139.48 | 1.92 |
| Dennbach | 3.30e-03 | 0.08 | 0.91 | 6.26e-03 | 8.11e-03 | 0.96 | 0.03 | 1.07e-04 | 2.75e-03 | 6.60e-04 | 0.00e+00 | 4.10 | 2.02 | 20.00 | 46.28 | 2.31 |
| Liersbach | 4.49e-02 | 0.20 | 0.74 | 8.65e-03 | 6.30e-03 | 0.80 | 0.19 | 5.11e-03 | 2.03e-03 | 2.54e-04 | 0.00e+00 | 2.00 | 1.41 | 28.94 | 77.87 | 2.69 |
| Nohnerbach | 1.52e-01 | 0.32 | 0.49 | 1.83e-02 | 2.27e-02 | 0.56 | 0.33 | 9.53e-02 | 8.65e-03 | 1.07e-03 | 9.00e-06 | 1.56 | 1.25 | 31.26 | 57.05 | 1.82 |
| Sahrbach | 8.68e-02 | 0.26 | 0.61 | 2.52e-02 | 1.23e-02 | 0.66 | 0.32 | 1.18e-02 | 1.22e-02 | 1.28e-03 | 2.00e-06 | 1.50 | 1.22 | 45.60 | 86.19 | 1.89 |
| Staffelbach | 3.05e-02 | 0.26 | 0.70 | 1.09e-02 | 5.21e-03 | 0.77 | 0.22 | 1.03e-02 | 4.03e-03 | 1.12e-03 | 1.00e-06 | 2.99 | 1.73 | 38.00 | 38.12 | 1.00 |
| Trierbach | 1.10e-01 | 0.36 | 0.47 | 4.34e-02 | 1.40e-02 | 0.56 | 0.32 | 9.13e-02 | 2.52e-02 | 2.14e-03 | 0.00e+00 | 1.03 | 1.01 | 55.06 | 84.78 | 1.54 |
| Upper Ahr | 1.36e-01 | 0.40 | 0.41 | 2.85e-02 | 2.12e-02 | 0.48 | 0.39 | 1.07e-01 | 1.70e-02 | 4.19e-03 | 7.59e-04 | 1.08 | 1.04 | 252.34 | 382.54 | 2.03 |
| Vischelbach | 4.64e-02 | 0.27 | 0.62 | 1.11e-02 | 1.09e-02 | 0.70 | 0.28 | 9.06e-03 | 8.62e-03 | 1.51e-03 | 0.00e+00 | 1.66 | 1.29 | 20.70 | 40.00 | 1.93 |
| Weidenbach | 4.28e-03 | 0.18 | 0.80 | 8.79e-03 | 5.95e-03 | 0.88 | 0.12 | 1.48e-03 | 3.20e-03 | 5.35e-04 | 0.00e+00 | 2.43 | 1.56 | 37.90 | 77.85 | 2.05 |
| Wirftbach | 9.76e-02 | 0.31 | 0.54 | 3.65e-02 | 1.68e-02 | 0.61 | 0.32 | 4.55e-02 | 2.42e-02 | 1.16e-03 | 1.37e-04 | 2.30 | 1.52 | 25.20 | 41.57 | 1.65 |
Another idea: Insert the average, min and maximum slope of the catchment:
| Unnamed: 0 | agriculture | grassland | forest | build | bare_soils | slope | Bach | Distance | Lati | Long | Latitude | Longitude | Streamcode | zone | min | max | mean | |
|---|---|---|---|---|---|---|---|---|---|---|---|---|---|---|---|---|---|---|
| 0 | 0 | 1.36e-01 | 0.40 | 0.41 | 2.85e-02 | 2.12e-02 | 0.52 | UpperAhr | 34.20 | 50.38 | 6.81 | 50.44 | 6.65 | 27181 | 27181 | 0.00e+00 | 7.76 | 1.08 |
| 1 | 1 | 1.39e-01 | 0.32 | 0.51 | 2.27e-02 | 1.33e-02 | 1.08 | Armuthsbach | 18.80 | 50.45 | 6.87 | 50.47 | 6.71 | 271856 | 271856 | 1.28e-03 | 10.33 | 1.36 |
| 2 | 2 | 8.68e-02 | 0.26 | 0.61 | 2.52e-02 | 1.23e-02 | 1.06 | Sahrbach | 2.17 | 50.51 | 6.97 | 50.54 | 6.85 | 27188 | 27188 | 3.25e-03 | 9.56 | 1.48 |
| 3 | 3 | 1.10e-01 | 0.36 | 0.47 | 4.34e-02 | 1.40e-02 | 0.84 | Trierbach | 34.00 | 50.36 | 6.83 | 50.30 | 6.91 | 27184 | 27184 | 5.90e-03 | 6.73 | 1.06 |
| 4 | 4 | 2.23e-02 | 0.22 | 0.72 | 3.57e-02 | 4.95e-03 | 1.70 | Adenauerbach | 11.20 | 50.44 | 6.93 | 50.35 | 6.97 | 27186 | 27186 | 4.36e-03 | 9.98 | 2.10 |
| 5 | 5 | 3.05e-02 | 0.26 | 0.70 | 1.09e-02 | 5.21e-03 | 1.67 | Staffelbach | 10.20 | 50.48 | 7.03 | 50.46 | 7.11 | 271874 | 271874 | 4.25e-03 | 7.51 | 1.95 |
| 6 | 6 | 4.28e-03 | 0.18 | 0.80 | 8.79e-03 | 5.95e-03 | 2.33 | Weidenbach | 8.30 | 50.48 | 7.02 | 50.39 | 7.03 | 2718741 | 2718741 | 1.68e-02 | 9.49 | 2.41 |
| 7 | 7 | 1.52e-01 | 0.32 | 0.49 | 1.83e-02 | 2.27e-02 | 0.96 | Nohnerbach | 35.50 | 50.36 | 6.83 | 50.28 | 6.88 | 271812 | 271812 | 3.17e-03 | 5.75 | 0.89 |
| 8 | 8 | 4.49e-02 | 0.20 | 0.74 | 8.65e-03 | 6.30e-03 | 2.30 | Liersbach | 10.00 | 50.46 | 6.94 | 50.53 | 6.83 | 271872 | 271872 | 8.37e-03 | 9.08 | 2.15 |
| 9 | 9 | 3.30e-03 | 0.08 | 0.91 | 6.26e-03 | 8.11e-03 | 1.68 | Dennbach | 6.30 | 50.48 | 6.99 | 50.42 | 6.97 | 2718748 | 2718748 | 1.75e-02 | 9.95 | 2.38 |
| 10 | 10 | 9.76e-02 | 0.31 | 0.54 | 3.65e-02 | 1.68e-02 | 1.49 | Wirftbach | 22.00 | 50.37 | 6.84 | 50.34 | 6.93 | 271899 | 271899 | 4.81e-03 | 7.69 | 1.25 |
| 11 | 11 | 4.97e-02 | 0.24 | 0.68 | 1.57e-02 | 8.11e-03 | 1.37 | Ansbach | 22.00 | 50.43 | 6.85 | 50.44 | 6.75 | 271854 | 271854 | 1.29e-02 | 9.03 | 1.63 |
| 12 | 12 | 4.64e-02 | 0.27 | 0.62 | 1.11e-02 | 1.09e-02 | 1.45 | Vischelbach | 1.00 | 50.51 | 6.98 | 50.57 | 6.94 | 271892 | 271892 | 4.75e-03 | 7.21 | 1.26 |
| Bach | slope | min | max | mean | slopevalley_stream | |
|---|---|---|---|---|---|---|
| Streamcode | ||||||
| 27181 | UpperAhr | 0.52 | 0.00e+00 | 7.76 | 1.08 | 2.09 |
| 271856 | Armuthsbach | 1.08 | 1.28e-03 | 10.33 | 1.36 | 1.26 |
| 27188 | Sahrbach | 1.06 | 3.25e-03 | 9.56 | 1.48 | 1.40 |
| 27184 | Trierbach | 0.84 | 5.90e-03 | 6.73 | 1.06 | 1.26 |
| 27186 | Adenauerbach | 1.70 | 4.36e-03 | 9.98 | 2.10 | 1.24 |
| 271874 | Staffelbach | 1.67 | 4.25e-03 | 7.51 | 1.95 | 1.17 |
| 2718741 | Weidenbach | 2.33 | 1.68e-02 | 9.49 | 2.41 | 1.03 |
| 271812 | Nohnerbach | 0.96 | 3.17e-03 | 5.75 | 0.89 | 0.92 |
| 271872 | Liersbach | 2.30 | 8.37e-03 | 9.08 | 2.15 | 0.94 |
| 2718748 | Dennbach | 1.68 | 1.75e-02 | 9.95 | 2.38 | 1.41 |
| 271899 | Wirftbach | 1.49 | 4.81e-03 | 7.69 | 1.25 | 0.84 |
| 271854 | Ansbach | 1.37 | 1.29e-02 | 9.03 | 1.63 | 1.19 |
| 271892 | Vischelbach | 1.45 | 4.75e-03 | 7.21 | 1.26 | 0.87 |
1.2.1.1 Alternatively, load a better table:
array([0.     , 0.00004, 0.00257, 0.     , 0.00001, 0.     , 0.00003,
       0.00001, 0.     , 0.00029, 0.     , 0.03368, 0.00066])
Or take water data from ESA table:
| wkt_geom | Treecover | Grassland | Cropland | Built-up | Bare_spars | Waterbody | LULC_TOTAL | Unnamed: 0 | agriculture | grassland | forest | build | bare_soils | slope | sqrt_s | Distance | Lati | Long | Latitude | Longitude | Streamcode | Bach_y | Area | Max_Q | Bache | SUM1407 | Q_area | Log_Q_area | |
|---|---|---|---|---|---|---|---|---|---|---|---|---|---|---|---|---|---|---|---|---|---|---|---|---|---|---|---|---|---|
| Adenauerbach | MultiPolygon (((4103890.61303603276610374 3029... | 0.84 | 0.14 | 4.89e-03 | 1.76e-02 | 1.54e-03 | 1.00e-06 | 1167920 | 3 | 2.23e-02 | 0.22 | 0.72 | 3.57e-02 | 4.95e-03 | 1.79 | 1.34 | 11.2 | 50.44 | 6.93 | 50.35 | 6.97 | 27186 | Adenauer | 58.45 | 108.72 | Adenauerbach | 80.00 | 1.86 | -4.29 |
| Ansbach | MultiPolygon (((4090406.74759881710633636 3042... | 0.74 | 0.24 | 1.36e-02 | 6.92e-03 | 8.61e-04 | 0.00e+00 | 301917 | 10 | 4.97e-02 | 0.24 | 0.68 | 1.57e-02 | 8.11e-03 | 2.50 | 1.58 | 22.0 | 50.43 | 6.85 | 50.44 | 6.75 | 271854 | Ans | 15.00 | 41.13 | Ansbach | 115.45 | 2.74 | -4.05 |
| Armuthsbach | MultiPolygon (((4086674.71472339006140828 3044... | 0.57 | 0.38 | 3.90e-02 | 9.93e-03 | 1.28e-03 | 0.00e+00 | 1493201 | 0 | 1.39e-01 | 0.32 | 0.51 | 2.27e-02 | 1.33e-02 | 1.71 | 1.31 | 18.8 | 50.45 | 6.87 | 50.47 | 6.71 | 271856 | Armuths | 72.60 | 139.48 | Armuthsbach | 140.85 | 1.92 | -4.37 |
| Dennbach | MultiPolygon (((4105954.62636257708072662 3038... | 0.96 | 0.03 | 1.07e-04 | 2.75e-03 | 6.60e-04 | 0.00e+00 | 392272 | 8 | 3.30e-03 | 0.08 | 0.91 | 6.26e-03 | 8.11e-03 | 4.10 | 2.02 | 6.3 | 50.48 | 6.99 | 50.42 | 6.97 | 2718748 | Denn | 20.00 | 46.28 | Dennbach | 99.99 | 2.31 | -4.28 |
| Liersbach | MultiPolygon (((4098323.02225150354206562 3050... | 0.80 | 0.19 | 5.11e-03 | 2.03e-03 | 2.54e-04 | 0.00e+00 | 539988 | 7 | 4.49e-02 | 0.20 | 0.74 | 8.65e-03 | 6.30e-03 | 2.00 | 1.41 | 10.0 | 50.46 | 6.94 | 50.53 | 6.83 | 271872 | Liers | 28.94 | 77.87 | Liersbach | 115.45 | 2.69 | -4.59 |
| Unnamed: 0 | agriculture | grassland | forest | build | bare_soils | slope | Bach_x | Distance | Lati | Long | Latitude | Longitude | Bach_y | Area | Max_Q | Bache | SUM1407 | Q_area | Log_Q_area | |
|---|---|---|---|---|---|---|---|---|---|---|---|---|---|---|---|---|---|---|---|---|
| Streamcode | ||||||||||||||||||||
| 271856 | 0 | 1.39e-01 | 0.32 | 0.51 | 2.27e-02 | 1.33e-02 | 1.08 | Armuthsbach | 18.80 | 50.45 | 6.87 | 50.47 | 6.71 | Armuths | 72.60 | 139.48 | Armuthsbach | 140.85 | 1.92 | -4.37 |
| 27188 | 1 | 8.68e-02 | 0.26 | 0.61 | 2.52e-02 | 1.23e-02 | 1.06 | Sahrbach | 2.17 | 50.51 | 6.97 | 50.54 | 6.85 | Sahr | 45.60 | 86.19 | Sahrbach | 140.85 | 1.89 | -4.37 |
| 27184 | 2 | 1.10e-01 | 0.36 | 0.47 | 4.34e-02 | 1.40e-02 | 0.84 | Trierbach | 34.00 | 50.36 | 6.83 | 50.30 | 6.91 | Trier | 55.06 | 84.78 | Trierbach | 80.00 | 1.54 | -3.78 |
| 27186 | 3 | 2.23e-02 | 0.22 | 0.72 | 3.57e-02 | 4.95e-03 | 1.70 | Adenauerbach | 11.20 | 50.44 | 6.93 | 50.35 | 6.97 | Adenauer | 58.45 | 108.72 | Adenauerbach | 80.00 | 1.86 | -4.29 |
| 271874 | 4 | 3.05e-02 | 0.26 | 0.70 | 1.09e-02 | 5.21e-03 | 1.67 | Staffelbach | 10.20 | 50.48 | 7.03 | 50.46 | 7.11 | Staffel | 38.00 | 38.12 | Staffelbach | 79.00 | 1.00 | -4.88 |
| 2718741 | 5 | 4.28e-03 | 0.18 | 0.80 | 8.79e-03 | 5.95e-03 | 2.33 | Weidenbach | 8.30 | 50.48 | 7.02 | 50.39 | 7.03 | Weiden | 37.90 | 77.85 | Weidenbach | 79.23 | 2.05 | -4.50 |
| 271812 | 6 | 1.52e-01 | 0.32 | 0.49 | 1.83e-02 | 2.27e-02 | 0.96 | Nohnerbach | 35.50 | 50.36 | 6.83 | 50.28 | 6.88 | Nohner | 31.26 | 57.05 | Nohnerbach | 102.60 | 1.82 | -3.99 |
| 271872 | 7 | 4.49e-02 | 0.20 | 0.74 | 8.65e-03 | 6.30e-03 | 2.30 | Liersbach | 10.00 | 50.46 | 6.94 | 50.53 | 6.83 | Liers | 28.94 | 77.87 | Liersbach | 115.45 | 2.69 | -4.59 |
| 2718748 | 8 | 3.30e-03 | 0.08 | 0.91 | 6.26e-03 | 8.11e-03 | 1.68 | Dennbach | 6.30 | 50.48 | 6.99 | 50.42 | 6.97 | Denn | 20.00 | 46.28 | Dennbach | 99.99 | 2.31 | -4.28 |
| 271899 | 9 | 9.76e-02 | 0.31 | 0.54 | 3.65e-02 | 1.68e-02 | 1.49 | Wirftbach | 22.00 | 50.37 | 6.84 | 50.34 | 6.93 | Wirft | 25.20 | 41.57 | Wirftbach | 80.00 | 1.65 | -4.28 |
| 271854 | 10 | 4.97e-02 | 0.24 | 0.68 | 1.57e-02 | 8.11e-03 | 1.37 | Ansbach | 22.00 | 50.43 | 6.85 | 50.44 | 6.75 | Ans | 15.00 | 41.13 | Ansbach | 115.45 | 2.74 | -4.05 |
| 271892 | 11 | 4.64e-02 | 0.27 | 0.62 | 1.11e-02 | 1.09e-02 | 1.45 | Vischelbach | 1.00 | 50.51 | 6.98 | 50.57 | 6.94 | Vischel | 20.70 | 40.00 | Vischelbach | 131.00 | 1.93 | -4.59 |
| 27181 | 12 | 1.36e-01 | 0.40 | 0.41 | 2.85e-02 | 2.12e-02 | 0.52 | Upper Ahr | 35.00 | 50.37 | 6.80 | 50.43 | 6.66 | UpperAhr | 252.34 | 382.54 | Upper Ahr | 108.00 | 2.03 | NaN |
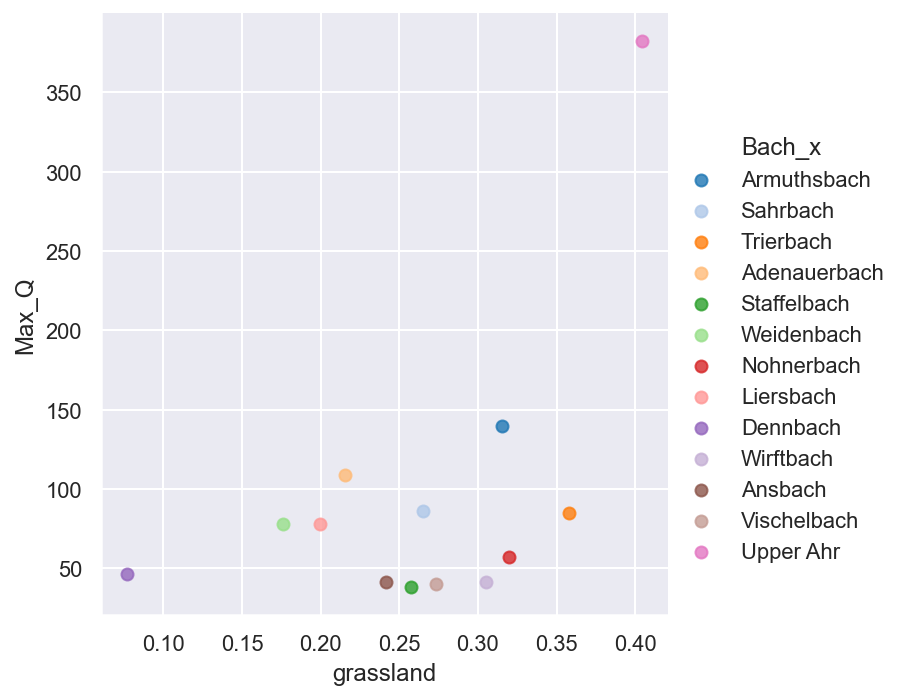
| Unnamed: 0 | agriculture | grassland | forest | build | bare_soils | slope_x | Bach_x | Distance | Lati | Long | Latitude | Longitude | Bach_y | Area | Max_Q | Bache | SUM1407 | Q_area | Log_Q_area | Bach | slope_y | min | max | mean | slopevalley_stream | |
|---|---|---|---|---|---|---|---|---|---|---|---|---|---|---|---|---|---|---|---|---|---|---|---|---|---|---|
| Streamcode | ||||||||||||||||||||||||||
| 271856 | 0 | 1.39e-01 | 0.32 | 0.51 | 2.27e-02 | 1.33e-02 | 1.08 | Armuthsbach | 18.80 | 50.45 | 6.87 | 50.47 | 6.71 | Armuths | 72.60 | 139.48 | Armuthsbach | 140.85 | 1.92 | -4.37 | Armuthsbach | 1.08 | 1.28e-03 | 10.33 | 1.36 | 1.26 |
| 27188 | 1 | 8.68e-02 | 0.26 | 0.61 | 2.52e-02 | 1.23e-02 | 1.06 | Sahrbach | 2.17 | 50.51 | 6.97 | 50.54 | 6.85 | Sahr | 45.60 | 86.19 | Sahrbach | 140.85 | 1.89 | -4.37 | Sahrbach | 1.06 | 3.25e-03 | 9.56 | 1.48 | 1.40 |
| 27184 | 2 | 1.10e-01 | 0.36 | 0.47 | 4.34e-02 | 1.40e-02 | 0.84 | Trierbach | 34.00 | 50.36 | 6.83 | 50.30 | 6.91 | Trier | 55.06 | 84.78 | Trierbach | 80.00 | 1.54 | -3.78 | Trierbach | 0.84 | 5.90e-03 | 6.73 | 1.06 | 1.26 |
| 27186 | 3 | 2.23e-02 | 0.22 | 0.72 | 3.57e-02 | 4.95e-03 | 1.70 | Adenauerbach | 11.20 | 50.44 | 6.93 | 50.35 | 6.97 | Adenauer | 58.45 | 108.72 | Adenauerbach | 80.00 | 1.86 | -4.29 | Adenauerbach | 1.70 | 4.36e-03 | 9.98 | 2.10 | 1.24 |
| 271874 | 4 | 3.05e-02 | 0.26 | 0.70 | 1.09e-02 | 5.21e-03 | 1.67 | Staffelbach | 10.20 | 50.48 | 7.03 | 50.46 | 7.11 | Staffel | 38.00 | 38.12 | Staffelbach | 79.00 | 1.00 | -4.88 | Staffelbach | 1.67 | 4.25e-03 | 7.51 | 1.95 | 1.17 |
| 2718741 | 5 | 4.28e-03 | 0.18 | 0.80 | 8.79e-03 | 5.95e-03 | 2.33 | Weidenbach | 8.30 | 50.48 | 7.02 | 50.39 | 7.03 | Weiden | 37.90 | 77.85 | Weidenbach | 79.23 | 2.05 | -4.50 | Weidenbach | 2.33 | 1.68e-02 | 9.49 | 2.41 | 1.03 |
| 271812 | 6 | 1.52e-01 | 0.32 | 0.49 | 1.83e-02 | 2.27e-02 | 0.96 | Nohnerbach | 35.50 | 50.36 | 6.83 | 50.28 | 6.88 | Nohner | 31.26 | 57.05 | Nohnerbach | 102.60 | 1.82 | -3.99 | Nohnerbach | 0.96 | 3.17e-03 | 5.75 | 0.89 | 0.92 |
| 271872 | 7 | 4.49e-02 | 0.20 | 0.74 | 8.65e-03 | 6.30e-03 | 2.30 | Liersbach | 10.00 | 50.46 | 6.94 | 50.53 | 6.83 | Liers | 28.94 | 77.87 | Liersbach | 115.45 | 2.69 | -4.59 | Liersbach | 2.30 | 8.37e-03 | 9.08 | 2.15 | 0.94 |
| 2718748 | 8 | 3.30e-03 | 0.08 | 0.91 | 6.26e-03 | 8.11e-03 | 1.68 | Dennbach | 6.30 | 50.48 | 6.99 | 50.42 | 6.97 | Denn | 20.00 | 46.28 | Dennbach | 99.99 | 2.31 | -4.28 | Dennbach | 1.68 | 1.75e-02 | 9.95 | 2.38 | 1.41 |
| 271899 | 9 | 9.76e-02 | 0.31 | 0.54 | 3.65e-02 | 1.68e-02 | 1.49 | Wirftbach | 22.00 | 50.37 | 6.84 | 50.34 | 6.93 | Wirft | 25.20 | 41.57 | Wirftbach | 80.00 | 1.65 | -4.28 | Wirftbach | 1.49 | 4.81e-03 | 7.69 | 1.25 | 0.84 |
| 271854 | 10 | 4.97e-02 | 0.24 | 0.68 | 1.57e-02 | 8.11e-03 | 1.37 | Ansbach | 22.00 | 50.43 | 6.85 | 50.44 | 6.75 | Ans | 15.00 | 41.13 | Ansbach | 115.45 | 2.74 | -4.05 | Ansbach | 1.37 | 1.29e-02 | 9.03 | 1.63 | 1.19 |
| 271892 | 11 | 4.64e-02 | 0.27 | 0.62 | 1.11e-02 | 1.09e-02 | 1.45 | Vischelbach | 1.00 | 50.51 | 6.98 | 50.57 | 6.94 | Vischel | 20.70 | 40.00 | Vischelbach | 131.00 | 1.93 | -4.59 | Vischelbach | 1.45 | 4.75e-03 | 7.21 | 1.26 | 0.87 |
| 27181 | 12 | 1.36e-01 | 0.40 | 0.41 | 2.85e-02 | 2.12e-02 | 0.52 | Upper Ahr | 35.00 | 50.37 | 6.80 | 50.43 | 6.66 | UpperAhr | 252.34 | 382.54 | Upper Ahr | 108.00 | 2.03 | NaN | UpperAhr | 0.52 | 0.00e+00 | 7.76 | 1.08 | 2.09 |
Note: last run was using the ESA and updated CLC map combination.
What contributes tho most to a maximum outflow of a stream in the AHr valley?
array(['agriculture', 'grassland', 'forest', 'build', 'bare_soils',
       'Treecover', 'Grassland', 'Cropland', 'Built-up', 'Bare_spars',
       'Waterbody', 'slope', 'sqrt_s', 'Area', 'Q_area'], dtype=object)
Index(['Adenauerbach', 'Ansbach', 'Armuthsbach', 'Dennbach', 'Liersbach',
       'Nohnerbach', 'Sahrbach', 'Staffelbach', 'Trierbach', 'Upper Ahr',
       'Vischelbach', 'Weidenbach', 'Wirftbach'],
      dtype='object', name='Bache')
apply a scaler
array([[-0.97, -0.58,  0.67, ..., -0.26,  0.08, -0.22],
       [-0.43, -0.25,  0.38, ...,  0.65, -0.65,  1.78],
       [ 1.36,  0.65, -0.88, ..., -0.37,  0.31, -0.08],
       ...,
       [-0.49,  0.14, -0.05, ..., -0.44, -0.56, -0.06],
       [-1.33, -1.06,  1.24, ...,  0.57, -0.27,  0.22],
       [ 0.53,  0.53, -0.63, ...,  0.41, -0.48, -0.7 ]])
Or work via a pipeline
Pipeline(steps=[('standardscaler', StandardScaler()),
                ('linearregression', LinearRegression())])
0.4080211574906166
Index(['agriculture', 'grassland', 'forest', 'build', 'bare_soils', 'slope_x',
       'Area', 'max', 'mean', 'SUM1407'],
      dtype='object')
1.2.1.2 Variable Importance Plot
Note: sum of rainfall must be added
Pipeline(steps=[('standardscaler', StandardScaler())])
explained_variance:  0.2087
mean_squared_log_error:  0.4949
r2:  -0.2372
MAE:  84.8102
MSE:  19954.0113
RMSE:  141.2587
7 KFolds results:
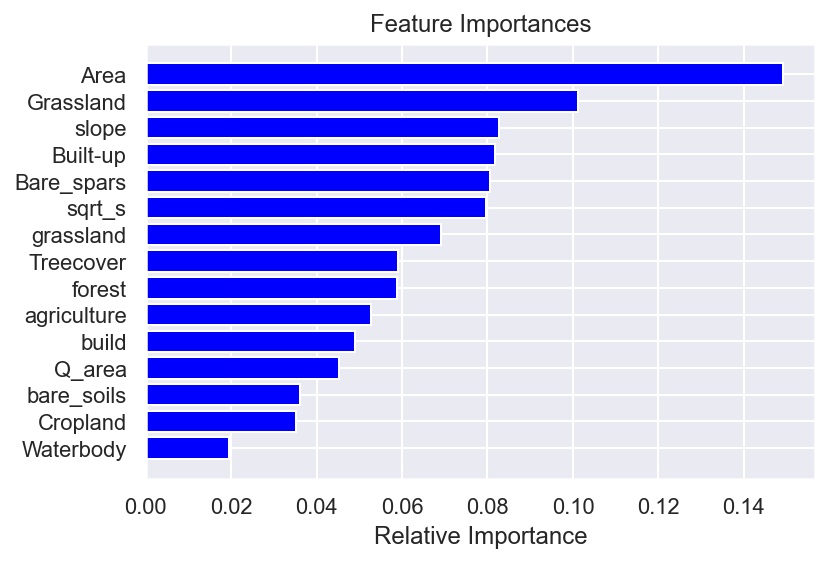
5 KFolds results:
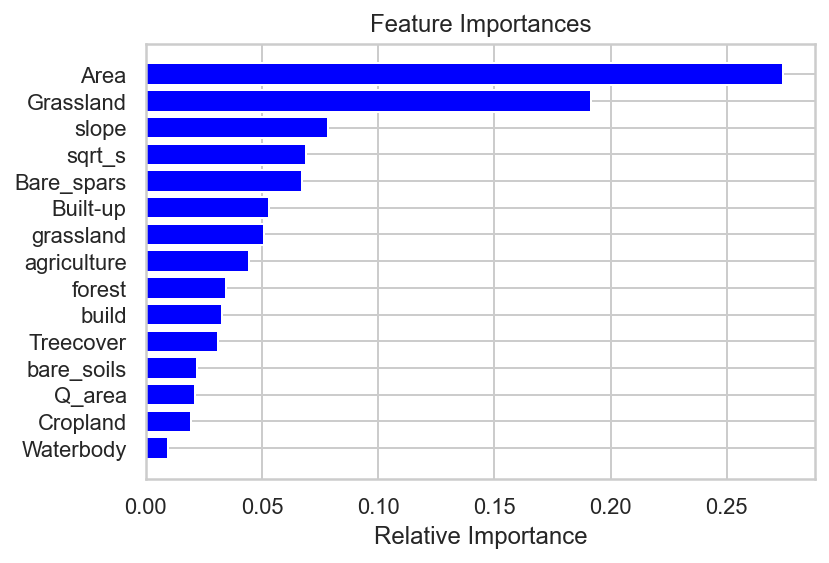
The surface area of the catchment, the percentage grassland, the slope of the stream, build-up area's and bare soils are the 5 most important features.
RandomForestRegressor(max_depth=13, max_features='sqrt', n_estimators=800)
Index(['agriculture', 'grassland', 'forest', 'build', 'bare_soils',
       'Treecover', 'Grassland', 'Cropland', 'Built-up', 'Bare_spars',
       'Waterbody', 'slope', 'sqrt_s', 'Area', 'Max_Q', 'Q_area'],
      dtype='object')
1.2.2 Permutation of feature importances
| agriculture | grassland | forest | build | bare_soils | Waterbody | Q_area | slope | sqrt_s | Max_Q | |
|---|---|---|---|---|---|---|---|---|---|---|
| Bache | ||||||||||
| Adenauerbach | 2.23e-02 | 0.22 | 0.72 | 3.57e-02 | 4.95e-03 | 1.00e-06 | 1.86 | 1.79 | 1.34 | 108.72 |
| Ansbach | 4.97e-02 | 0.24 | 0.68 | 1.57e-02 | 8.11e-03 | 0.00e+00 | 2.74 | 2.50 | 1.58 | 41.13 |
| Armuthsbach | 1.39e-01 | 0.32 | 0.51 | 2.27e-02 | 1.33e-02 | 0.00e+00 | 1.92 | 1.71 | 1.31 | 139.48 |
| Dennbach | 3.30e-03 | 0.08 | 0.91 | 6.26e-03 | 8.11e-03 | 0.00e+00 | 2.31 | 4.10 | 2.02 | 46.28 |
| Liersbach | 4.49e-02 | 0.20 | 0.74 | 8.65e-03 | 6.30e-03 | 0.00e+00 | 2.69 | 2.00 | 1.41 | 77.87 |
| Nohnerbach | 1.52e-01 | 0.32 | 0.49 | 1.83e-02 | 2.27e-02 | 9.00e-06 | 1.82 | 1.56 | 1.25 | 57.05 |
| Sahrbach | 8.68e-02 | 0.26 | 0.61 | 2.52e-02 | 1.23e-02 | 2.00e-06 | 1.89 | 1.50 | 1.22 | 86.19 |
| Staffelbach | 3.05e-02 | 0.26 | 0.70 | 1.09e-02 | 5.21e-03 | 1.00e-06 | 1.00 | 2.99 | 1.73 | 38.12 |
| Trierbach | 1.10e-01 | 0.36 | 0.47 | 4.34e-02 | 1.40e-02 | 0.00e+00 | 1.54 | 1.03 | 1.01 | 84.78 |
| Upper Ahr | 1.36e-01 | 0.40 | 0.41 | 2.85e-02 | 2.12e-02 | 7.59e-04 | 2.03 | 1.08 | 1.04 | 382.54 |
| Vischelbach | 4.64e-02 | 0.27 | 0.62 | 1.11e-02 | 1.09e-02 | 0.00e+00 | 1.93 | 1.66 | 1.29 | 40.00 |
| Weidenbach | 4.28e-03 | 0.18 | 0.80 | 8.79e-03 | 5.95e-03 | 0.00e+00 | 2.05 | 2.43 | 1.56 | 77.85 |
| Wirftbach | 9.76e-02 | 0.31 | 0.54 | 3.65e-02 | 1.68e-02 | 1.37e-04 | 1.65 | 2.30 | 1.52 | 41.57 |
| agriculture | grassland | forest | build | bare_soils | slope | Area | Max_Q | Q_area | Log_Q_area | |
|---|---|---|---|---|---|---|---|---|---|---|
| Bache | ||||||||||
| Armuthsbach | 1.39e-01 | 0.32 | 0.51 | 2.27e-02 | 1.33e-02 | 1.08 | 72.60 | 139.48 | 1.92 | 0.65 |
| Sahrbach | 8.68e-02 | 0.26 | 0.61 | 2.52e-02 | 1.23e-02 | 1.06 | 45.60 | 86.19 | 1.89 | 0.64 |
| Trierbach | 1.10e-01 | 0.36 | 0.47 | 4.34e-02 | 1.40e-02 | 0.84 | 55.06 | 84.78 | 1.54 | 0.43 |
| Adenauerbach | 2.23e-02 | 0.22 | 0.72 | 3.57e-02 | 4.95e-03 | 1.70 | 58.45 | 108.72 | 1.86 | 0.62 |
| Weidenbach | 4.28e-03 | 0.18 | 0.80 | 8.79e-03 | 5.95e-03 | 2.33 | 37.90 | 77.85 | 2.05 | 0.72 |
| Nohnerbach | 1.52e-01 | 0.32 | 0.49 | 1.83e-02 | 2.27e-02 | 0.96 | 31.26 | 57.05 | 1.82 | 0.60 |
| Liersbach | 4.49e-02 | 0.20 | 0.74 | 8.65e-03 | 6.30e-03 | 2.30 | 28.94 | 77.87 | 2.69 | 0.99 |
| Dennbach | 3.30e-03 | 0.08 | 0.91 | 6.26e-03 | 8.11e-03 | 1.68 | 20.00 | 46.28 | 2.31 | 0.84 |
| Wirftbach | 9.76e-02 | 0.31 | 0.54 | 3.65e-02 | 1.68e-02 | 1.49 | 25.20 | 41.57 | 1.65 | 0.50 |
| Ansbach | 4.97e-02 | 0.24 | 0.68 | 1.57e-02 | 8.11e-03 | 1.37 | 15.00 | 41.13 | 2.74 | 1.01 |
| Vischelbach | 4.64e-02 | 0.27 | 0.62 | 1.11e-02 | 1.09e-02 | 1.45 | 20.70 | 40.00 | 1.93 | 0.66 |
| Upper Ahr | 1.36e-01 | 0.40 | 0.41 | 2.85e-02 | 2.12e-02 | 0.52 | 252.34 | 382.54 | 1.52 | 0.18 |
RandomForestRegressor(bootstrap=False, n_estimators=1900, n_jobs=3, verbose=1)
array([[-0.52, -0.77,  0.78, ...,  1.67, -0.06,  0.03],
       [ 1.61,  0.71, -1.04, ..., -0.3 , -0.61, -0.59],
       [ 0.53,  0.53, -0.63, ..., -0.7 ,  0.31,  0.41],
       ...,
       [-1.35, -2.28,  1.97, ...,  0.81,  2.56,  2.32],
       [ 1.31,  1.75, -1.6 , ...,  0.17, -1.21, -1.38],
       [-0.43, -0.25,  0.38, ...,  1.78,  0.56,  0.65]])
| agriculture | grassland | forest | build | bare_soils | Waterbody | Q_area | slope | sqrt_s | Max_Q | |
|---|---|---|---|---|---|---|---|---|---|---|
| Bache | ||||||||||
| Adenauerbach | 2.23e-02 | 0.22 | 0.72 | 3.57e-02 | 4.95e-03 | 1.00e-06 | 1.86 | 1.79 | 1.34 | 108.72 |
| Ansbach | 4.97e-02 | 0.24 | 0.68 | 1.57e-02 | 8.11e-03 | 0.00e+00 | 2.74 | 2.50 | 1.58 | 41.13 |
| Armuthsbach | 1.39e-01 | 0.32 | 0.51 | 2.27e-02 | 1.33e-02 | 0.00e+00 | 1.92 | 1.71 | 1.31 | 139.48 |
| Dennbach | 3.30e-03 | 0.08 | 0.91 | 6.26e-03 | 8.11e-03 | 0.00e+00 | 2.31 | 4.10 | 2.02 | 46.28 |
| Liersbach | 4.49e-02 | 0.20 | 0.74 | 8.65e-03 | 6.30e-03 | 0.00e+00 | 2.69 | 2.00 | 1.41 | 77.87 |
| Nohnerbach | 1.52e-01 | 0.32 | 0.49 | 1.83e-02 | 2.27e-02 | 9.00e-06 | 1.82 | 1.56 | 1.25 | 57.05 |
| Sahrbach | 8.68e-02 | 0.26 | 0.61 | 2.52e-02 | 1.23e-02 | 2.00e-06 | 1.89 | 1.50 | 1.22 | 86.19 |
| Staffelbach | 3.05e-02 | 0.26 | 0.70 | 1.09e-02 | 5.21e-03 | 1.00e-06 | 1.00 | 2.99 | 1.73 | 38.12 |
| Trierbach | 1.10e-01 | 0.36 | 0.47 | 4.34e-02 | 1.40e-02 | 0.00e+00 | 1.54 | 1.03 | 1.01 | 84.78 |
| Upper Ahr | 1.36e-01 | 0.40 | 0.41 | 2.85e-02 | 2.12e-02 | 7.59e-04 | 2.03 | 1.08 | 1.04 | 382.54 |
| Vischelbach | 4.64e-02 | 0.27 | 0.62 | 1.11e-02 | 1.09e-02 | 0.00e+00 | 1.93 | 1.66 | 1.29 | 40.00 |
| Weidenbach | 4.28e-03 | 0.18 | 0.80 | 8.79e-03 | 5.95e-03 | 0.00e+00 | 2.05 | 2.43 | 1.56 | 77.85 |
| Wirftbach | 9.76e-02 | 0.31 | 0.54 | 3.65e-02 | 1.68e-02 | 1.37e-04 | 1.65 | 2.30 | 1.52 | 41.57 |
array([[-0.52, -0.77,  0.78, ...,  1.67, -0.06,  0.03],
       [ 1.61,  0.71, -1.04, ..., -0.3 , -0.61, -0.59],
       [ 0.53,  0.53, -0.63, ..., -0.7 ,  0.31,  0.41],
       ...,
       [-1.35, -2.28,  1.97, ...,  0.81,  2.56,  2.32],
       [ 1.31,  1.75, -1.6 , ...,  0.17, -1.21, -1.38],
       [-0.43, -0.25,  0.38, ...,  1.78,  0.56,  0.65]])
array([[ 1.36,  0.65, -0.88,  0.15,  0.31, -0.35, -0.08, -0.42, -0.37],
       [ 0.32,  0.03, -0.15,  0.37,  0.13, -0.34, -0.15, -0.69, -0.68]])
array([ 0.52, -0.09])
RandomForestRegressor(bootstrap=False, n_estimators=1900, n_jobs=3, verbose=1)
array([0. , 0.32, 0.32, 0.01, 0.03, 0.32, 0. , 0. , 0. ])
Mid Ahr 9.48e-02 0.30 0.56 2.59e-02 1.41e-02
rf.predict([[9.48e-02 ,0.30 ,0.56,2.59e-02,1.41e-02 ]]) # land use, area, mm RF, np.log(680/ 115)
220.28719533659807
Weidenbach 4.28e-03 0.18 0.80 8.79e-03 5.95e-03
290.7183749754727
Now I got a value to back-test the Lekan runoff model.
1.2.2.1 squared error
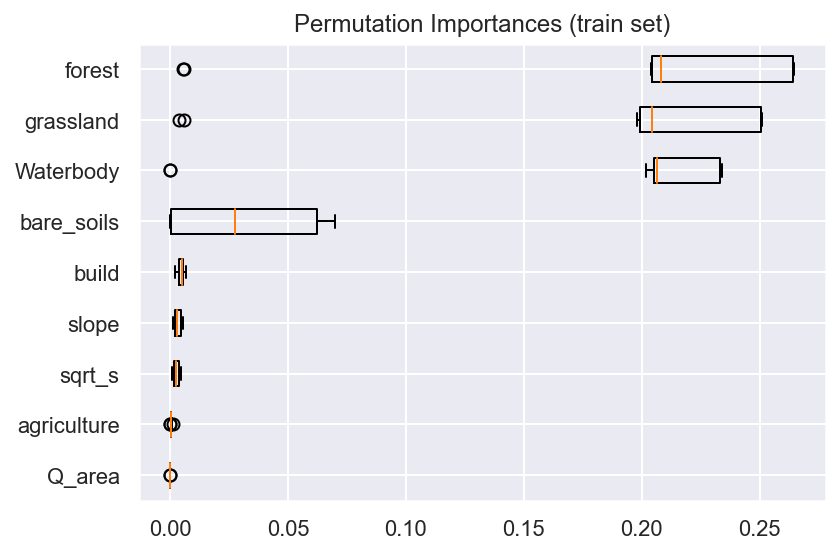
1.2.2.2 absolute error
1.2.2.3 SelectKBest
1.4 Import Raster to PostgreSQL/PostGIS and view in QGIS
The command parameters are:
<SRID>—Spatial reference identifier
<PATH/TO/RASTER FILE>—Full path to the raster file (such as C:\MyData\land\landuse.tif)
<SCHEMA>—Target schema where the new raster table will be created
<DBTABLE>—New database table to be created (usually the same name as the source raster file)
<DATABASE>—Target database where the table will be created
The following example uses raster2pgsql to create an input file and upload it into 100x100 tiles. The -I option will create a spatial GiST index on the raster column after the table is created. This is strongly recommended for improved performance. The -C option will apply the raster constraints (SRID, pixel size and so on) to ensure the new raster table is correctly registered in the raster_columns view.
raster2pgsql -s 4236 -I -C -M *.tif -F -t 100x100 public.demelevation | psql -d gisdb
1.4.1 Make a Xarray
-99.83
<xarray.Dataset>
Dimensions:       (lon: 1201, lat: 1201, grid_mapping: 12)
Coordinates:
  * lon           (lon) float64 6.0 6.001 6.002 6.003 ... 6.998 6.998 6.999 7.0
  * lat           (lat) float64 50.0 50.0 50.0 50.0 50.0 ... 51.0 51.0 51.0 51.0
  * grid_mapping  (grid_mapping) |S1 b's' b'c' b'a' b'l' ... b'c' b't' b'o' b'r'
Data variables:
    z             (lat, lon) float32 ...
Attributes:
    Conventions:  CF-1.7
    title:        Produced by grdconvert
    history:      grdconvert C:/Users/Kurt/.gmt/server/earth/earth_relief/ear...
GMT_version: 6.2.0 [64-bit] [MP]- lon: 1201
- lat: 1201
- grid_mapping: 12
- lon(lon)float646.0 6.001 6.002 ... 6.998 6.999 7.0
- long_name :
- longitude
- units :
- degrees_east
- standard_name :
- longitude
- axis :
- X
- actual_range :
- [6. 7.]
array([6. , 6.000833, 6.001667, ..., 6.998333, 6.999167, 7. ])
- lat(lat)float6450.0 50.0 50.0 ... 51.0 51.0 51.0
- long_name :
- latitude
- units :
- degrees_north
- standard_name :
- latitude
- axis :
- Y
- actual_range :
- [50. 51.]
array([50. , 50.000833, 50.001667, ..., 50.998333, 50.999167, 51. ])
- grid_mapping(grid_mapping)|S1b's' b'c' b'a' ... b't' b'o' b'r'
- spatial_ref :
- GEOGCS["unknown", DATUM["WGS_1984", SPHEROID["WGS 84",6378137,298.257223563, AUTHORITY["EPSG","7030"]], AUTHORITY["EPSG","6326"]], PRIMEM["Greenwich",0, AUTHORITY["EPSG","8901"]], UNIT["degree",0.0174532925199433, AUTHORITY["EPSG","9122"]], AXIS["Longitude",EAST], AXIS["Latitude",NORTH]]
array([b's', b'c', b'a', b'l', b'e', b'_', b'f', b'a', b'c', b't', b'o', b'r'],
      dtype='|S1')
- z(lat, lon)float32...
- grid_mapping :
- grid_mapping
- long_name :
- z
- actual_range :
- [-220. 713.]
[1442401 values with dtype=float32]
- Conventions :
- CF-1.7
- title :
- Produced by grdconvert
- history :
- grdconvert C:/Users/Kurt/.gmt/server/earth/earth_relief/earth_relief_03s_g/N50E006.earth_relief_03s_g.jp2 -GC:/Users/Kurt/.gmt/server/earth/earth_relief/earth_relief_03s_g/N50E006.earth_relief_03s_g.nc=ns -fg -Vq --IO_NC4_DEFLATION_LEVEL=9 --GMT_HISTORY=readonly
- GMT_version :
- 6.2.0 [64-bit] [MP]